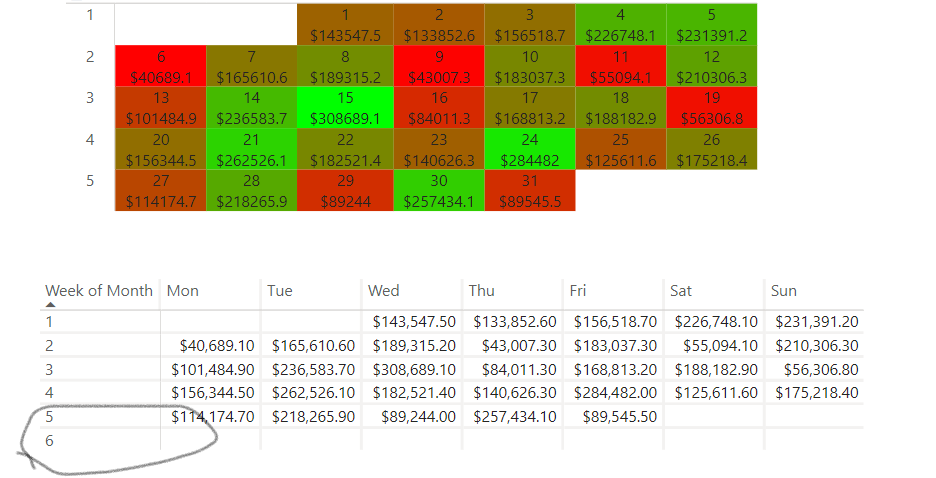
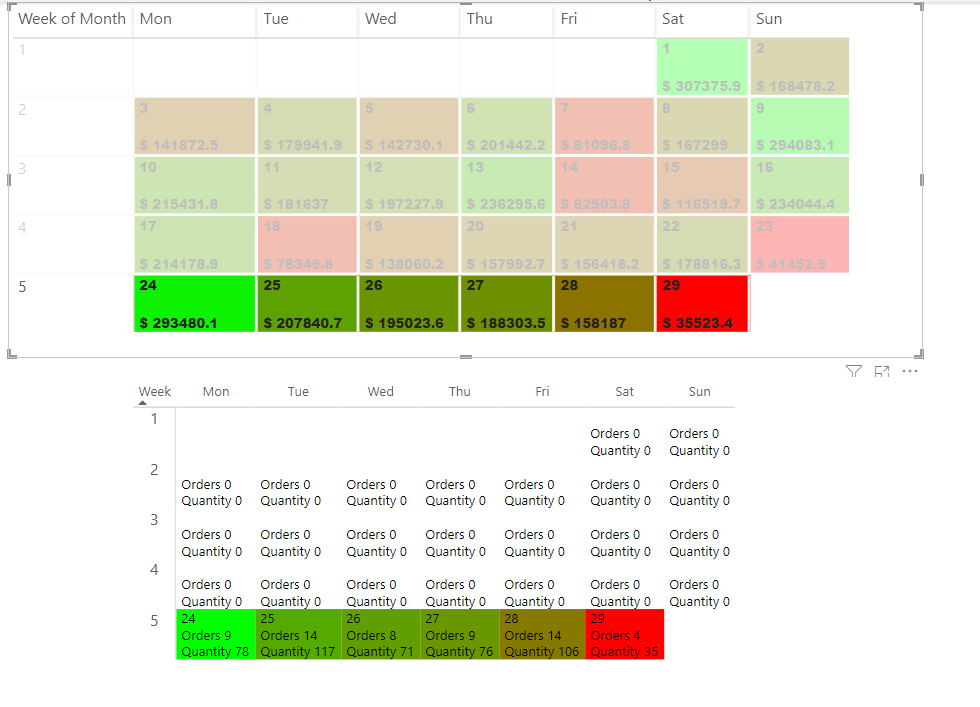
I created a custom calendar that displays the day of the month and total sales in the respective cell.
The problem i am trying to solve is when I select a row or particular day the table below filters completely down to the selection. I want to set up the sales measure so that if I select a date or week in the calendar matrix it displays the values for what is selected and blanks for every other day/week. Basically keep the whole table just only display values for the selection.
To see what I am talking about use the tab named “Calendar Selector”. I am using this file to practice but will be taking the code from here to apply to something else at work which I can’t upload here.
Maybe I don’t understand you correctly, but why would you want to accomplish this? The upper table and lower table are exactly the same, consdiring their values, right?
Why would you like to display to simililair tables?
Currently they are but this isn’t a final product. Lower table could have different values etc.
Depending on the request of my end user they may not want all the data in the calendar and prefer everything in the lower table and then select from calendar what they want to see. I am always getting questions/suggestions as to how power bi formats something when you hit a filter which then makes columns etc. in a matrix go away etc and how to get the visual to act differently.
Did I answer enough? Lengthy and there are still several more reasons but wanted to keep it concise.
If you would like to have same data in different / slightly different visualizations, you might need a duplication of the dimensions you are using. Everything you try to do with functions like ALL() or REMOVEFILTER() won’t work, because they affect both visualizations in the same way ; a different behaviour is (in my opinion) impossible to achieve with your current data model.
It hasn’t same data. This is a test file and the second table is there to verify DAX is spitting out correctly. You are focusing too much on the visuals used rather then the problem I am trying to solve. I am trying to figure out how to create a measure that when I select on one matrix it filters and displays the values i pick but doesn’t make all the cells go away.
This technique will be used in other applications at work. I am trying to learn a new technique is all and learn and better understand DAX. I keep running into issues getting my DAX measures to run because I am always getting errors with how I set things up. I have been through the DAX classes and I wish they had some that would go over errors and why and how to fix not just show do this…
No, the bar chart is not the issue.
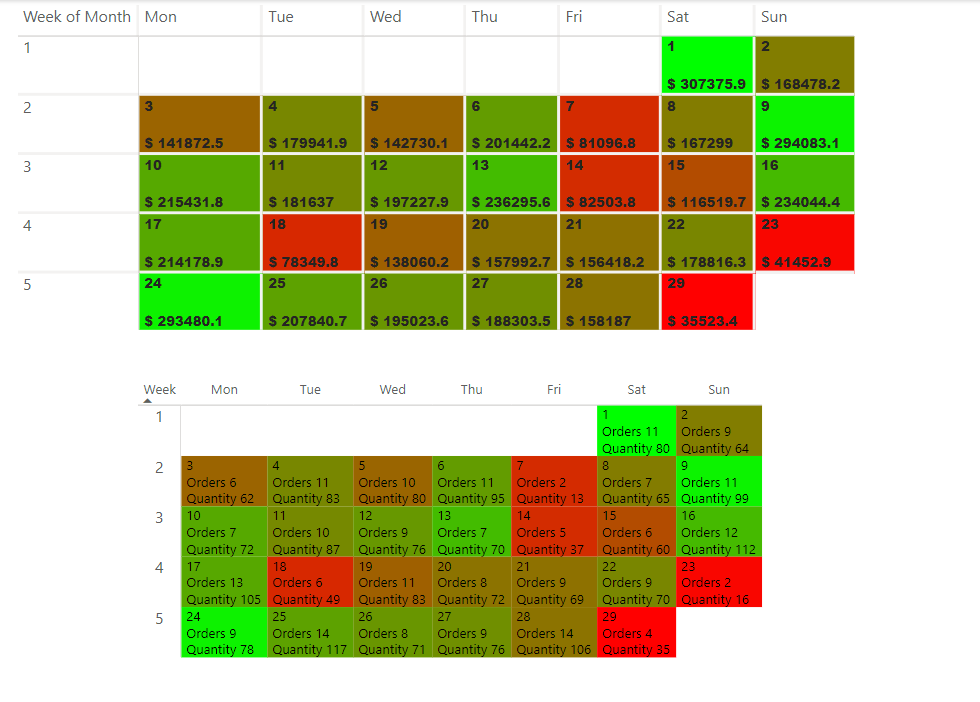
The top matrix calendar when I select a day or week value I want the matrix below that to display the corresponding data and blanks for the rest of the non-selected days. Right now if I select in the top matrix the second matrix completely filters to just those values. I don’t want that. I want all cells to show up in the second matrix but selected cells having whatever data is in there. So basically non-selected cells returning a blank value.
I will use the same date dimension but the original data will change as this is a practice data set for sales etc from the Mastering DAX class. I will be utilizing a completely different data set at work that is supervisor observations not sales data. So I can adjust the measure and table being looked at. Just need the format of how to make this happen.
No problem and I appreciate the questions and the help. I know the file i sent added confusion and apologize for that. Look forward to working with you on this and improving my skills with advanced DAX.
The last problem I faced, of which I wasn’t able to fix it / It’s probably immedetialy fixed on your computer, is with the weekdays.
While I used your file and your date query, my week started on sunday while yours started on monday. (check excel file below) Difference in weekdays.xlsx (10.6 KB)
I forced this with replaced values in PQ editor, so maybe you need to undo that on your PC.
Unfortunately, the logic of your nice looking calender (upper table) isn’t that smooth anymore. Hopefully you can fix this. Otherwise, let me know and I will think along.
I believe this is a column in the table where the weekday was assigned 0 for Monday vice Sunday. I need to check again but that isn’t hard coded on a computer it is usually set within whatever app you work with such as outlook.
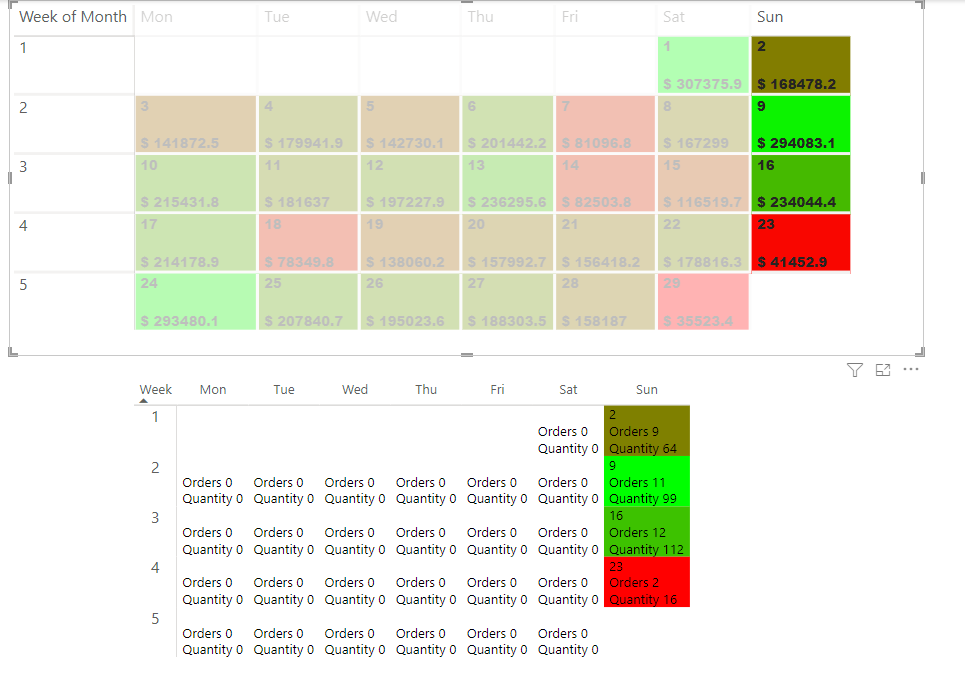
I moved your calculations and added the second date table and it works exactly as I needed it to.
Just had to add a conditional font formatting so that when deselected values show 0 their font becomes the background color of white and can’t be seen.
You are a genius!
Thank you again for the help. This was not the route I would have thought to go.
I don’t know if I can follow you on the color white. I made that transparant withh “#00000000”; then it’s always invisible, whatever the background may be. But, if it’s solved, it’s solved of course
Good that’s solved now and I enjoyed the collaboration and challenge.
All values showed as 0 that weren’t selected. I think it is because I didn’t know where to put the conditional formatting measure.
The other minor formatting thing is in the second table it displays a week 6 whether there is one in the month or not. I think I need another conditional formatting statement for that part as well.
I actually saw why it worked. I changed the calculation to add +0 at the end. This is why everything was showing up, including week 6. If I remove the + 0 then it doesn’t function right and I am back to the original issue. For some reason your DM conditional measures don’t seem to want to put the 100000 in the non-selected boxes I am not sure why.
This is pretty close to what I want. The only thing to have happen is on the unselected days I want the cell to have nothing. It still shows Orders 0 and Quantity 0. I just want those cells to be empty.