Measures not calculating sum in matrix

Hi Sam,
So close.

Other than the total at the bottom it works with Year Level Code,

there is one more strange behaviour that I can not pinpoint.

When I switch between forecast and confirmed results which is supposed to switch the Selected Entrants value between the Confirmed Entrants and the Forecast Entrants formulas, the base totals break.

It works fine for confirmed, but not for forecast. However, the EOY forecast is correct in both cases and the base totals are now based on that!

File attached.

Fun.pbix (795.7 KB)

Thanks again

This is very complex with everything that’s going on here. I have to be honest it’s tough to understand all the moving parts being relatively unfamiliar with all the data, even though I’ve spent many hours on this now.

I think we just have to work logically through what the calculation is doing in the context of the total and try figure it out from there.

In the total field the SUMMARIZE function is building a virtual table of all the months in that particular context. The only month in the context though is March at the moment

image

So the table will only be one row.

Average Entrants will then be working out the below

image

I believe it’s likely to be the SUMX part of this formula.

Which is then jumping back to this part of the formula

This is where I’m lost. It’s way too complex to understand here.

We’re jumping back to about three different branches.

I truly would start again and build this one formula from scratch and not have it jumping between all of these, as I’m sure your struggling to understand every calculation as well.

I would create every calculation you need in the one formula for ‘Forecast Entrants’

This would make the number much easier to audit

Sam

Hi Sam,
I have attempted your suggestion.
As you said, there is a lot going on in this formula.
It is attempting a lot.
It first calculates the number of entrants for the timeframe selected , then averages those entrants across that timeframe to get a monthly average.
The final step is to calculate a cumulative total of those averages.
Hideously complex

Forecast Entrants Test = 
// Calculate timeframe for entrants. Previous year backdated by number of years selected
VAR MinYear = CALCULATE( MIN(Dates[Year]), ALLSELECTED(Dates) )
VAR StartYear = MinYear - [Back Year Selection]
VAR FinishYear = CALCULATE( MAX(Dates[Year]), ALLSELECTED(Dates) ) - 1
VAR DateRange = 
    FILTER(
        ALL(Dates),
        Dates[Year] >= StartYear && Dates[Year] <= FinishYear
    )

// Calculate the number of entrants in the given period
VAR NumberOfEntrants = 
    CALCULATE(
        COUNT('Average Entrance'[ID]),
        USERELATIONSHIP(Dates[Date], 'Average Entrance'[Confirmation Date])
    )

// Calculate the monthly average 
VAR MonthlyAverage = DIVIDE(NumberOfEntrants, [Back Year Selection], 0)

// Calculate the average total so that the column totals work
VAR AverageTotal = 
    SUMMARIZE(
        'Average Entrance', 
        'Average Entrance'[Year Level], 
        "Monthly Avg", MonthlyAverage
    )
VAR AverageEntrants = 
    IF(
        HASONEVALUE(Dates[Month Of Year]),
        MonthlyAverage,
        SUMX(AverageTotal, [Monthly Avg])													
    )                            

RETURN
// Round up the total to the nearest whole number (can't have a partial person)
ROUNDUP(
    // Calculate the cumulative total of the monthly average
    SUMX(
        SUMMARIZE(
            DateRange, Dates[Month Name],
            "Av Entrants", AverageEntrants,
            "MonthNumber", MIN(Dates[Month Of Year])
        ),
        [Av Entrants]
    ),
    0
)

I think the problem is coming in the NumberOfEntrants area. The context is only the current date, not the whole DateRange. I have yet to figure out how to modify the context to use an inactive relationship with the DateRange.

Thanks

Ok I’m still just trying to break this down to then build back up.

Highly recommend breaking things out and working on by one. The other problem placing variable all in the one formula is you can’t work out there behaviour.

All I’m reviewing first is this formula

Number of Entrants =
CALCULATE( COUNT(‘Average Entrance’[ID]),
USERELATIONSHIP(Dates[Date], ‘Average Entrance’[Confirmation Date]) )

And it returns this table.

This seems way off from what your trying to solve from what I can tell, so I think this is a good place to start.

Is this right?

Hi Sam
That is exactly what I got which is why I narrowed it down to that area.
It appears to be only using the current year in the calculation not the correct date range ( 2015-2017)
Thanks

Hi Sam,
I have been playing around with this measure to try and see if I can get it working.
It is definitely the root of the problem.

I isolated just the part that calculated the number of entrants to test and attempted to add the date range in.

Number of entrants test = 
// Calculate timeframe for entrants. Previous year backdated by number of years selected
VAR MinYear = CALCULATE( MIN(Dates[Year]), ALLSELECTED(Dates) )
VAR StartYear = MinYear - [Back Year Selection]
VAR FinishYear = CALCULATE( MAX(Dates[Year]), ALLSELECTED(Dates) ) - 1
VAR DateRange = 
    FILTER(
        ALL(Dates),
        Dates[Year] >= StartYear && Dates[Year] <= FinishYear 
    )

// Calculate the number of entrants in the given period
VAR NumberOfEntrants = 
    CALCULATE(       
        COUNT('Average Entrance'[ID]),
        DateRange
    )
    
RETURN
NumberOfEntrants

The result was a table of the end of year results, not the selected month (eg march).
I modified it to include the selected month.

Number of entrants test = 
// Calculate timeframe for entrants. Previous year backdated by number of years selected
VAR MinYear = CALCULATE( MIN(Dates[Year]), ALLSELECTED(Dates) )
VAR StartYear = MinYear - [Back Year Selection]
VAR FinishYear = CALCULATE( MAX(Dates[Year]), ALLSELECTED(Dates) ) - 1
VAR FinishMonth = SELECTEDVALUE(Dates[Month Of Year])
VAR DateRange = 
    FILTER(
        ALL(Dates),
        Dates[Year] >= StartYear && Dates[Year] <= FinishYear && Dates[Month Of Year] <= FinishMonth
    )

// Calculate the number of entrants in the given period
VAR NumberOfEntrants = 
    CALCULATE(       
        COUNT('Average Entrance'[ID]),
        DateRange
    )
    
RETURN
NumberOfEntrants

The theory behind this is that I would not need to calculate beyond the same month the previous year to get me valid results.

The results were closer, but not quite right.
They should look like this

but look like this

Once I get that bedded down, then I will be able to move onto the averages and cumulative averages.

Thanks
Fun.pbix (931.4 KB)

Hi Sam,
You’re probably getting sick of me.
I’m getting so close now…
I have modified the Number of Entrants DAX

Number of entrants test = 
// Calculate timeframe for entrants. Previous year backdated by number of years selected
VAR YearStartDate = STARTOFYEAR(Dates[Date])
VAR YearEndDate = ENDOFYEAR(Dates[Date])
VAR StartDate = DATE(YEAR(YearStartDate) - [Back Year Selection], MONTH(YearStartDate), DAY(YearStartDate))
VAR EndDate = DATE(YEAR(YearEndDate) - 1, Month(YearEndDate), DAY(YearEndDate))
VAR DateRange = 
    FILTER(
        ALL(Dates),
        Dates[Date] >= StartDate 
            && Dates[Date] <= EndDate
    )

// Calculate the number of entrants in the given period
VAR NumberOfEntrants = 
    CALCULATE(
        COUNT('Average Entrance'[ID]),
        DateRange,
        VALUES(Dates[Month Of Year]) // Bring the months back into the equation
    )
        
RETURN
NumberOfEntrants

The trick was to bring the months back in.
This gives me the correct total for the months chosen.

What puzzles me is that this is still the only month. I would have thought that by releasing the date context with ALL(Dates) I would have been able to see all months despite the dates slicer.

This means that my cumulative values are not correct.

So close … yet still not there.

Thanks

Ok this is looking a lot cleaner.

It looks like to me you’ve built your date range, which should flow down into the last variable. But then you’ve bought back the month & year context with VALUES. So whatever that is (because I can’t tell) is placing a filter back onto the result.

Is that what you really need? The ALL takes away the filter but you’ve bought back a specific one, which is a very specific time frame.

Maybe you just want to bring back the month not the month & year? It’s hard for me to say exactly.

Hi Sam,
I am bringing back Month of year (1 … 12) not Month and year.

Right, sorry I see, my mistake.

Still a bit lost. I would have to test this myself.

Can you just remind me exactly what you are trying to calculate here as well, just as been through a number of iterations and need to understand it again.

Hi Sam
Not surprising. This is doing my head in too.
On the tab Average Entrance 2 I have the base calculations where there is no month selected. You will see that the number table has the numbers per month.
The average table averages them over the number of years forecast (in this case 4).
What is messed up is the cumulative table. Where those number are coming from is anyone’s guess.
This is where I got to last night. I just have to fix this to get the cumulative totals right.

Then on the Funnel tab is the next weirdness.
I have modified the PY Girls / PY Boys measure to be based on the EOY Forecast measure rather than the Count Student Measure. The EOY Forecast measure just switches between forecast and confimed.

Everything is fine with confirmed. Forecast is totally bonkers! I can’t see why.

File attached.Fun.pbix (932.8 KB)

To simplify this;

One you’ve built all the variable etc in one formula to get the initial result you shouldn’t have to redo them every time.

This is likely why it’s quite confusing.

I’m am absolutely sure your formula can be immensely simplified.

I personally never find I need formulas this long.

You should be able to just branch off the initial calculation which is doing the date manipulation to the current context.

Also I find having a lot of data on one page then trying to audit specific numbers quite difficult.

What I like to do with more advanced formula is remove every distraction possible from a report page and then focus in a one specific aspect and get that right

I’m trying to focus on Cumulative total here

This is how I have it right now. As simple as possible

This is the formula I have currently.

I’m not really sure if it’s what you need, but this should be a start.

You’ll see here how simple the formula can be (relatively speaking) and still get results.

Testing = 
SUMX(
    FILTER(
        SUMMARIZE(
            ALLSELECTED( Dates ), Dates[Month Name],
            "Av Entrants", [Average Entrants Test],
            "Month Number", MIN(Dates[Month Of Year]) ),
        [Month Number] <= MAX(Dates[Month Of Year]) ),
    [Av Entrants] )

Trust me on this…try to simplify at every point along the way. You’ll be in a constant daze of where to next unless you do.

Sam

Hi Sam,
That is pretty close to what I had.
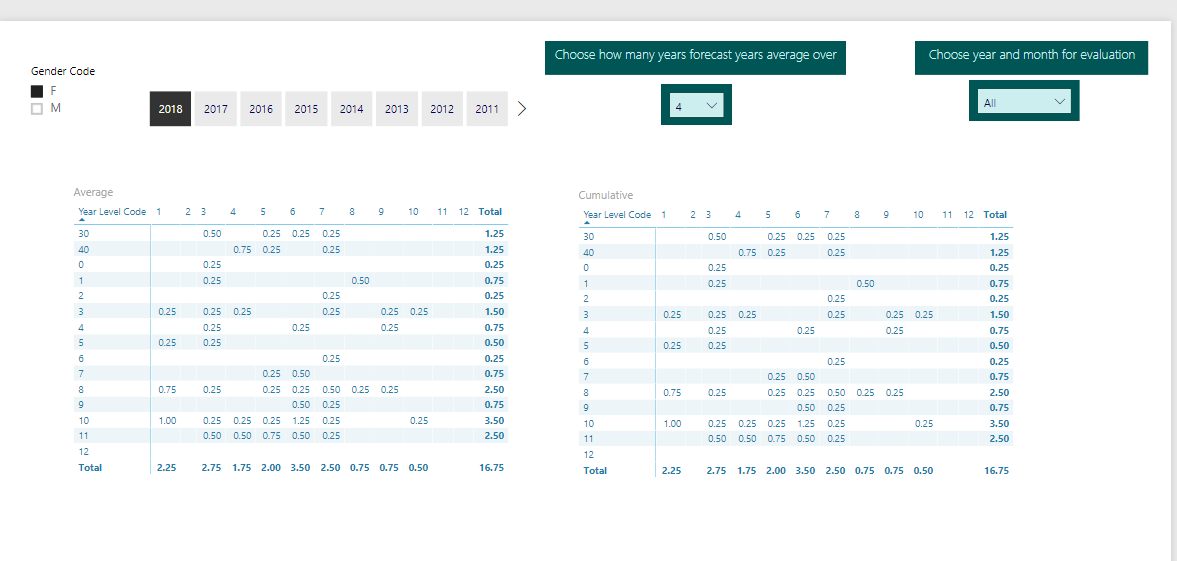
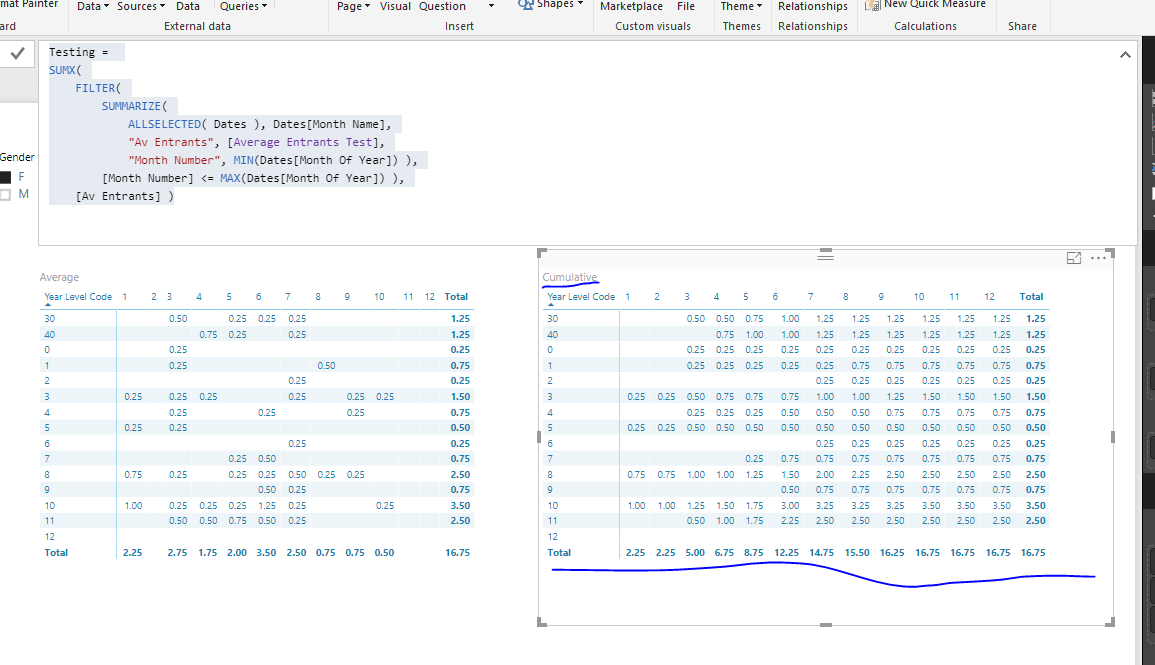
Strange that when I split it out into a different measure to calculate the cumulative it works, but in the same on it does not.
As long as it works.

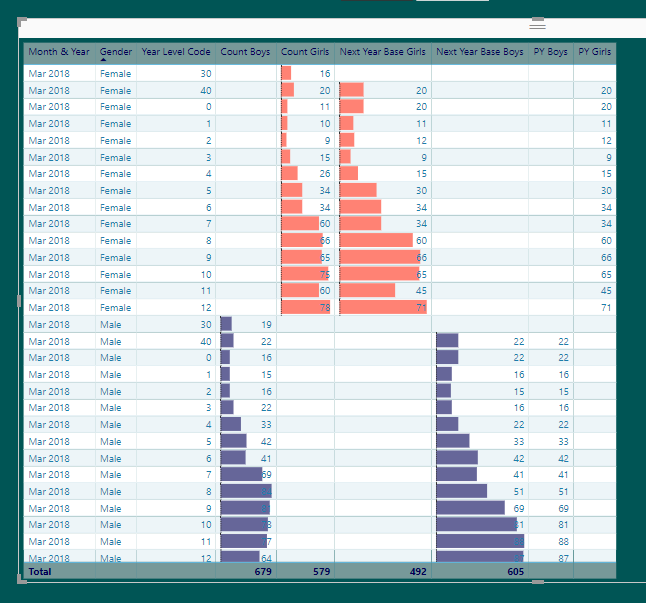
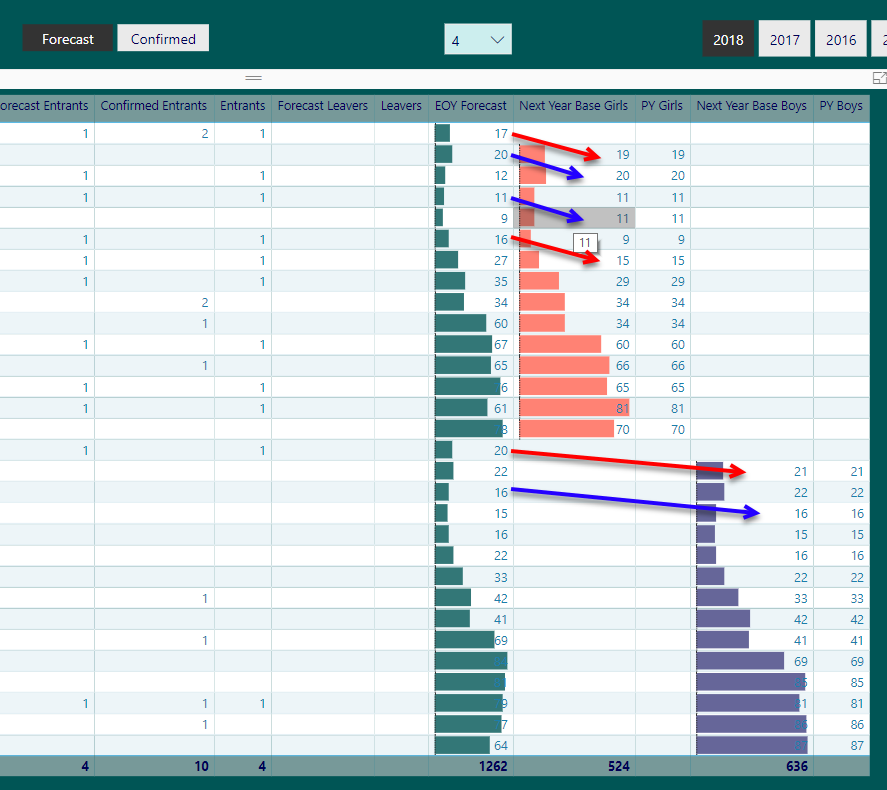
That just leaves the bizarre behaviour of the very original query we started off with where we try to calculate the next year base levels.

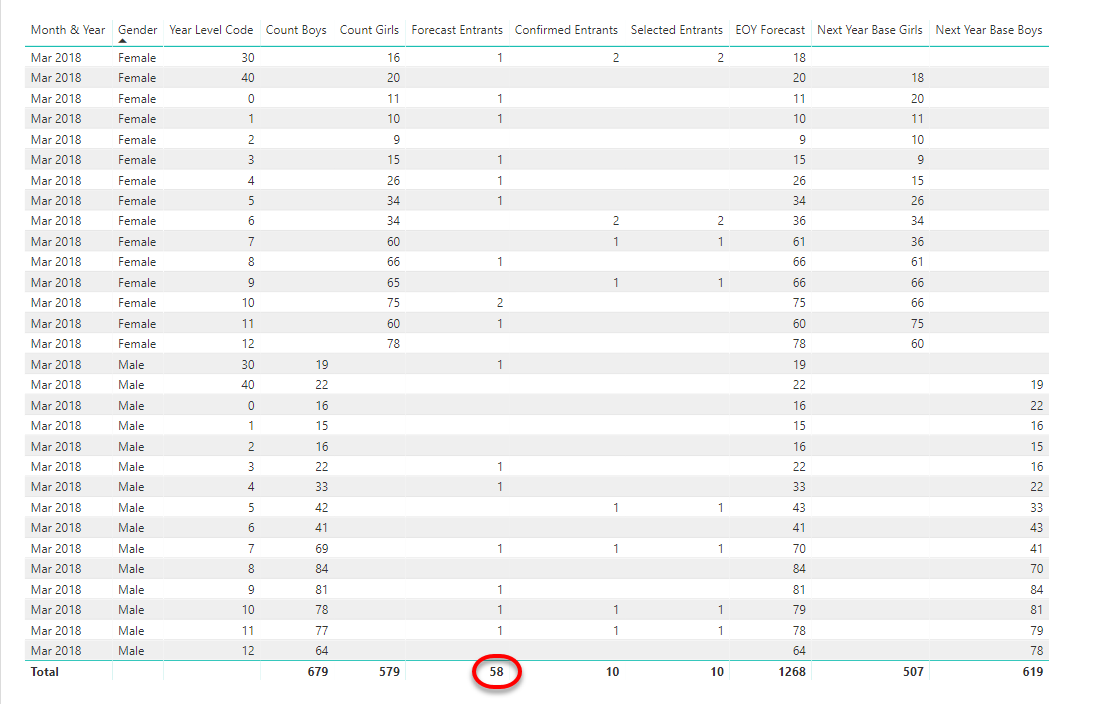
To recap. We start with the current count of students, lets say “Count Boys”, then add the entrants and remove the leavers to give the base.

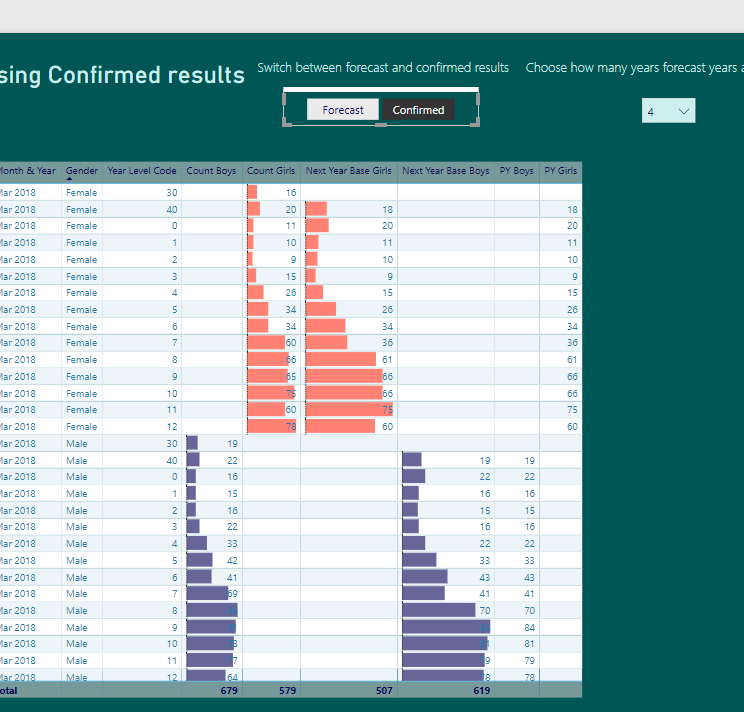
To make it more complicated, we have to be able to flip between expected and confirmed entrants.

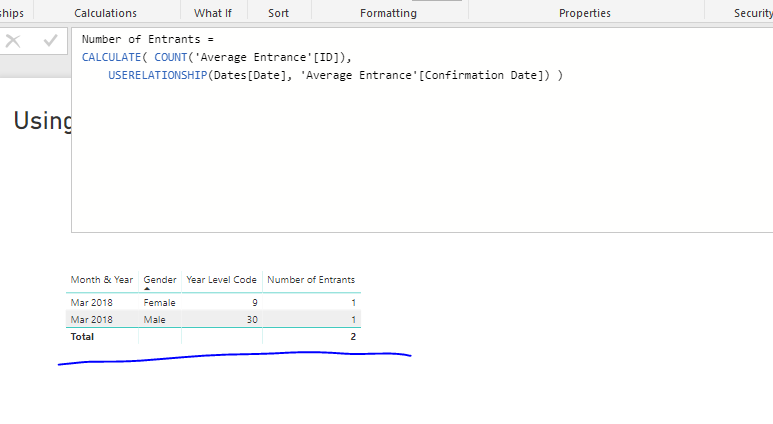
I have created a supporting table and measures for this.

I have modified the original PY Boys from

PY Boys = 
VAR PY = [Previous Year Level]
VAR ProcessDates = VALUES( 'Student Monthly Statistics'[Process Date] )
VAR PYCount = CALCULATE( [Count Boys], FILTER( ALL( 'Student Monthly Statistics' ), 'Student Monthly Statistics'[Year Level] = PY ), ProcessDates )

RETURN
IF( OR ( ISBLANK( [Previous Year Level] ), SELECTEDVALUE( Gender[Gender] ) <> "Male" ),
    BLANK(),
         PYCount )

to now contain the EOY forecast

PY Boys = 
VAR PY = [Previous Year Level]
VAR ProcessDates = VALUES( 'Student Monthly Statistics'[Process Date] )
VAR PYCount = CALCULATE( 
                    [EOY Forecast],
                    FILTER( 
                        ALL( 'Student Monthly Statistics' ), 
                        'Student Monthly Statistics'[Year Level] = PY && 'Student Monthly Statistics'[Gender] = "M"
                    ), 
                    ProcessDates 
                )

RETURN
IF( 
    OR ( 
        ISBLANK( [Previous Year Level] ), 
        SELECTEDVALUE( Gender[Gender] ) <> "Male" 
    ),
    BLANK(),
    PYCount 
)

The only difference here being the filter for male students and

 EOY Forecast = [Count Students] + [Entrants] - [Leavers]

Entrants = 
SWITCH(
    TRUE(),
    'Forecast Selection'[Forecast Selection] = "Confirmed", [Confirmed Entrants],
    'Forecast Selection'[Forecast Selection] = "Forecast", [Forecast Entrants],
    [Forecast Entrants]
)

Leavers = 
SWITCH(
    TRUE(),
    'Forecast Selection'[Forecast Selection] = "Confirmed", [Confirmed Leavers],
    'Forecast Selection'[Forecast Selection] = "Forecast", [Forecast Leavers],
    [Forecast Leavers]
)

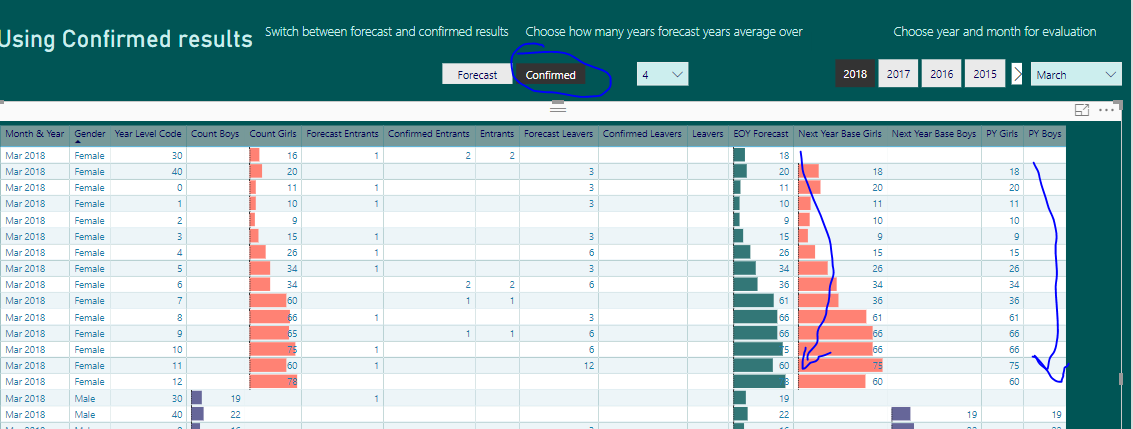
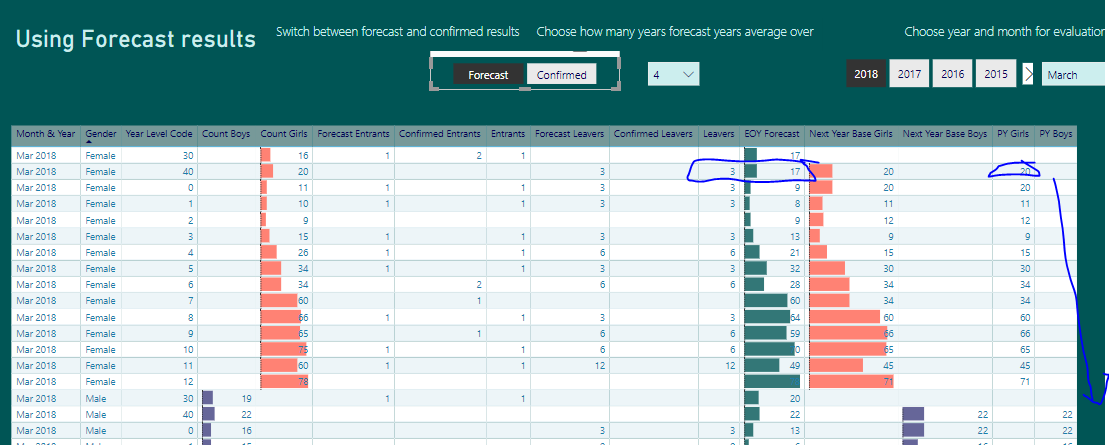
For reasons I cannot fathom it works perfectly when using the confirmed results, but goes haywire when using the forecast results.

It makes no sense as the PY Boys measure is referencing the same measure.

Attached is the cleaned up file.

Thanks
Fun.pbix (928.2 KB)

The big difference was here

“Av Entrants”, AverageEntrants,

You calculate it in a variable, while you see that in the formula I created I placed it in a filter context because I reference a measure.

“Av Entrants”, [Average Entrants Test],

Really small difference but can matter in some cases.

I only worked it out by testing a few things.

You know this might be controversial but I don’t like the DAX Formatter much at all. I’m presuming you use that to format the formulas.

I reckon that it make formula harder to understand. I much prefer a more compact version that flows a bit better.

In any case…

It looks to me to be calculating exactly the same as next year base. Is it not meant to be?

PY Boys = 
VAR PY = [Previous Year Level]
VAR ProcessDates = VALUES( 'Student Monthly Statistics'[Process Date] )
VAR PYCount = CALCULATE( [EOY Forecast],
                    FILTER( ALL( 'Student Monthly Statistics' ), 
                        'Student Monthly Statistics'[Year Level] = PY && 'Student Monthly Statistics'[Gender] = "M"), ProcessDates )

RETURN
IF( OR ( ISBLANK( [Previous Year Level] ), SELECTEDVALUE( Gender[Gender] ) <> "Male" ),
    BLANK(),
        PYCount )

And also changes as per the slicer selection

This needs to be simplified as is where I would start because you mentioned that this is what playing up, so I would drill into this and really work out the behaviour.

Forecast Entrants = 
VAR RoundedCumulative = ROUNDUP([Cumulative Entrants],0)
VAR EntrantsTotal = SUMMARIZE( 'Historical Entrants', 'Historical Entrants'[Year Level], "Entrants Total", RoundedCumulative)

RETURN
IF(
    OR(
        HASONEVALUE(Dates[Month & Year]),
        HASONEVALUE(Dates[Month Of Year])
    ),
    RoundedCumulative,
    SUMX(EntrantsTotal, [Entrants Total])
)

Simpler in my view…

Forecast Entrants = 
VAR RoundedCumulative = ROUNDUP([Cumulative Entrants],0)

RETURN
IF( OR( HASONEVALUE(Dates[Month & Year]), HASONEVALUE(Dates[Month Of Year]) ),
    RoundedCumulative,
        SUMX( SUMMARIZE( 'Historical Entrants', 'Historical Entrants'[Year Level],
            "Entrants Total", RoundedCumulative),
             [Entrants Total])) 

I think you need to review is this is correct and as expected, because this is what flows up into the ultimate formula

This one I believe

Entrants = 
SWITCH(
    TRUE(),
    'Forecast Selection'[Forecast Selection] = "Confirmed", [Confirmed Entrants],
    'Forecast Selection'[Forecast Selection] = "Forecast", [Forecast Entrants],
    [Forecast Entrants]
)

Hi,
In many ways I agree with you about the DAX formulas but I have to work to the client standard here.

The EOY Forecast column is correct in both cases. This is ultimately what is being passed up to the next year base.

What I can’t figure out is why is the base wrong for one and correct for the other.

If I got to the extreme and make both the Forecast Entrants = 0 and Forecast Leavers = 0 then it works.

There is something in those that break the calculation

Thanks

I’m major confused sorry.

I’m looking at these numbers and they seem to be matching out based on what the formulas are.

So due to my unfamiliarity with it all I’m a bit lost as to where next

I’ve selected Confirmed

and this seems to be working

Then I select forecast

This look to be working also??

Hi Sam,
I can see where you are getting confused.
In some cases the forecast works. I have highlighted them below in blue. In other cases it has not. They are red

In each case, the forecast is supposed to go down to the next line. Or, if you want to look at it the other way around, the current year level is supposed to get the previous year level’s EOY forecast.

I think we may be over complicating it. I am going to try and strip it right back, removing the gender component and start again. It should all then just continue to work once we add the gender context back in.

Thanks

But isn’t that number being added to. So the PY Boys is actually EOY Forecast + Forecast Entrants?

That’s what the formula is doing due to the SWITCH formula here

Entrants = 
SWITCH(
    TRUE(),
    'Forecast Selection'[Forecast Selection] = "Confirmed", [Confirmed Entrants],
    'Forecast Selection'[Forecast Selection] = "Forecast", [Forecast Entrants],
    [Forecast Entrants]
)

When you select forcasts it’s adding this
"Forecast", [Forecast Entrants]
To EOY Forecast

So when I added them all up it calculates correctly.

Hi,
No.
EOY = Current + Entrants - Leavers

Then PY Boys = Last Year EOY (for boys only)

If PY Boys = Last Year EOY + Entrants then something is wrong. It should not be doing that. We are doubling up