Measures not calculating sum in matrix

Hi Sam,
I think I am onto something here.

I think the problem is in the PY Boys DAX

More specifically:

VAR PYCount = CALCULATE( [EOY Forecast],
                    FILTER( ALL( 'Student Monthly Statistics' ), 
                        'Student Monthly Statistics'[Year Level] = PY && 'Student Monthly Statistics'[Gender] = "M"), ProcessDates )

The Filter should be ALLSELECTED. ALL includes data from other years. Since my forecast tables have data dating back many years, this is skewing the calculations.

I am experimenting with that now.

Thanks

Hi Sam,

Just you you know - this did not work. It breaks the calculation. Still trying.

Hi Sam,
I think I’ve nailed it.
I stripped it right back and started from scratch. The whole splitting by gender was causing problems so I (partially) abandoned that.

Back to basics
Count Students = COUNT('Student Monthly Statistics'[Student ID])

The to calculate the previous year level for year level. This has not changed.

Previous Year Level = 
CALCULATE( 
    SELECTEDVALUE( 'Year Levels Lookup'[Previous Year Level] ),
    RELATEDTABLE( 'Student Monthly Statistics' )
)

EOY Forecast - very simple

EOY Forecast = 
IF(
    'Forecast Selection'[Forecast Selection] = "Confirmed",
    [Count Students] + [Confirmed Entrants] - [Confirmed Leavers],
    [Count Students] + [Forecast Entrants] - [Forecast Leavers]
)

Now for the heavy lifting one. There may be a better way to do this. (Open to suggestions)

PY Count = 
VAR PY = [Previous Year Level]
VAR ProcessDates = VALUES( 'Student Monthly Statistics'[Process Date] )
VAR StudentGender = 
    CALCULATE(
        SELECTEDVALUE(Gender[Gender Code]),
        RELATEDTABLE('Student Monthly Statistics')
    )

VAR SingleGenderPY = 
     CALCULATE( 
        [EOY Forecast], 
        FILTER( 
            ALLSELECTED( 'Student Monthly Statistics' ), 
            'Student Monthly Statistics'[Year Level] = PY && 'Student Monthly Statistics'[Gender] = StudentGender
        ), 
        ProcessDates 
    )            
VAR MultiGenderPY = 
    CALCULATE( 
        [EOY Forecast], 
        FILTER( 
            ALLSELECTED( 'Student Monthly Statistics' ), 
            'Student Monthly Statistics'[Year Level] = PY
        ), 
        ProcessDates 
    )
    
RETURN
IF(
    HASONEVALUE(Gender[Gender]),
    SingleGenderPY,
    MultiGenderPY    
)

I had to bring student gender back in here as there are two scenarios where the table was split by gender and where it was not. Rather than creating two separate functions, I use the HASONEVALUE function to determine if I need to worry about the gender filter and then switch between the two different calculations.

Finally,

Next Year Base = 
IF( 
    ISBLANK( [Previous Year Level] ),
    BLANK(),
    [PY Count] 
)

I don’t yet have a total at the bottom, but it works! Phew!

Sounds and looks like you’ve really refined these which is great.

This is what it takes sometimes to get the best solution.

Many times when I work on complex things I go back and refine and optimize. Especially if there’s going to be a hand over and other are going to have to use and understand what’s going on.

This has been a good example of some of the complexities around DAX, that’s for sure.

Chrs
Sam

Thanks Sam.
It has been a learning experience.

Not sure if I should be starting a new topic for this, but it is related.

I am having trouble with the cumulative total for the historical averages. It is not quite right when I add a month slicer.

In the attached file, in the Historical Entrants Testing tab is the best place to see the behaviour.
I have two tables - Average and cumulative.
When there is no month selected in the slicer, everything is fine. The cumulative work well. You may recall that this is taking the average over the last four years, backdating it to the previous year. That is, if I choose 2018 as my current year, then I want to evaluate 2014 - 2017

Note how say March has an average total of 2.75 and a cumulative of 5

If I select march in the slicer I expect to have that filtered for just March with those values. However, that is not what I get


I know the problem is due to the cumulative DAX pattern

Cumulative Testing = 

VAR CumulativeEntrantStudents = 
    SUMX(
        FILTER(
            SUMMARIZE(
               ALLSELECTED(Dates), Dates[Year], Dates[Month Name],
                "Av Entrants", [Average Historical Entrants],
                "Month Number", MIN(Dates[Month Of Year]) 
            ),
            [Month Number] <= MAX(Dates[Month Of Year]) 
        ),
        [Av Entrants] 
    )

// VAR EntrantsTotal = SUMMARIZE('Historical Entrants', 'Historical Entrants'[Year Level], "Entrants Total", CumulativeEntrantStudents)

RETURN
CumulativeEntrantStudents

It is using ALLSELECTED in the filter.
In other places I have overcome this by using ALL and adding in a minimum to the date range. For example,

Cumulative Returning Students = 
VAR YearStartDate = STARTOFYEAR(Dates[Date])

VAR CumulativeReturningStudents = 
    CALCULATE(
        [Number Returning Students],
        FILTER(
            ALL(Dates), // Use ALL rather than ALLSELECTED to allow for month filter exclusion
            Dates[Date] >= YearStartDate &&
                Dates[Date] <= MAX(Dates[Date])
        )
    )
VAR ReturningTotal = SUMMARIZE('Returning Students', 'Returning Students'[Student Year Level], "Returning Total", CumulativeReturningStudents)

RETURN
IF(
    OR(
        HASONEVALUE(Gender[Gender Code]),
        HASONEVALUE(Dates[Month Of Year])
    ),
    CumulativeReturningStudents,
    SUMX(ReturningTotal, [Returning Total])
)

but this is not working in this case. I suspect it is because the dates are in the past.

Do you have a suggestion as to how to overcome this stumbling block?

Thanks
Fun.pbix (1.0 MB)

Hi Sam,
Sometimes writing out also seems to help.
I just needed to calculate the valid date range that the cumulative would be calculating over.

Cumulative Testing = 
// Calculate timeframe for entrants.
VAR YearEndDate = ENDOFYEAR(Dates[Date])
VAR SelectedMonth = SELECTEDVALUE(Dates[Month Of Year], 12)
VAR StartDate = STARTOFYEAR(Dates[Date])
VAR EndDate = DATE(YEAR(YearEndDate),SelectedMonth, DAY(YearEndDate))
VAR DateRange = 
    FILTER(
        ALL(Dates),
        Dates[Date] >= StartDate 
            && Dates[Date] <= EndDate
    )

VAR CumulativeEntrantStudents = 
    SUMX(
        FILTER(
            SUMMARIZE(
               DateRange, Dates[Month Name],
                "Av Entrants", [Average Historical Entrants],
                "Month Number", MIN(Dates[Month Of Year]) 
            ),
            [Month Number] <= MAX(Dates[Month Of Year]) 
        ),
        [Av Entrants] 
    )

VAR EntrantsTotal = SUMMARIZE('Historical Entrants', 'Historical Entrants'[Year Level], "Entrants Total", CumulativeEntrantStudents)

RETURN
IF(
    OR(
        HASONEVALUE(Gender[Gender Code]),
        HASONEVALUE(Dates[Month Of Year])
    ),
    CumulativeEntrantStudents,
    SUMX(EntrantsTotal, [Entrants Total])
)
   

The trick is actually in the VAR SelectedMonth = SELECTEDVALUE(Dates[Month Of Year], 12)
If a month has not been selected then it chooses December and the pattern continues to work for the whole year.

Thanks

Ok great stuff. Chrs

Hi Sam,
I seem to have come a full circle, right back to the start of this topic.

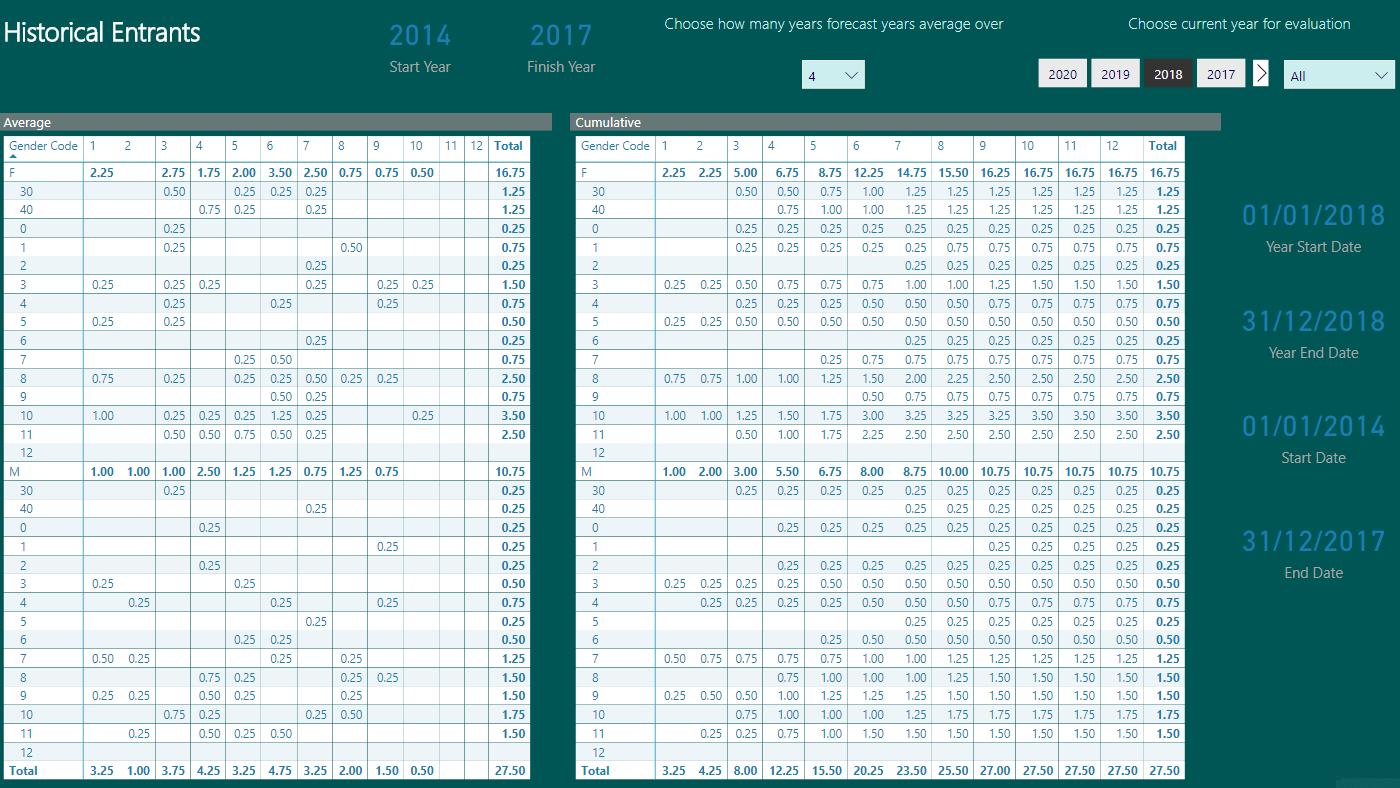
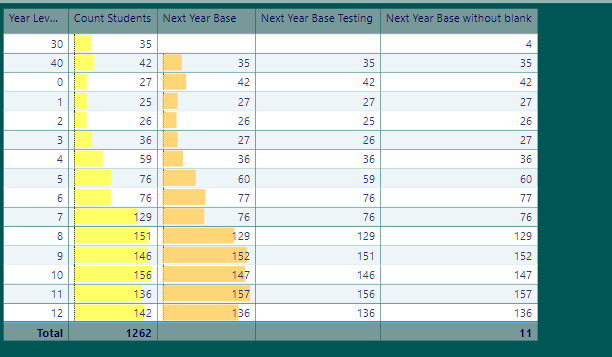
Right in the beginning, I had the problem where the measure did not calculate the sum at the bottom of the matrix.

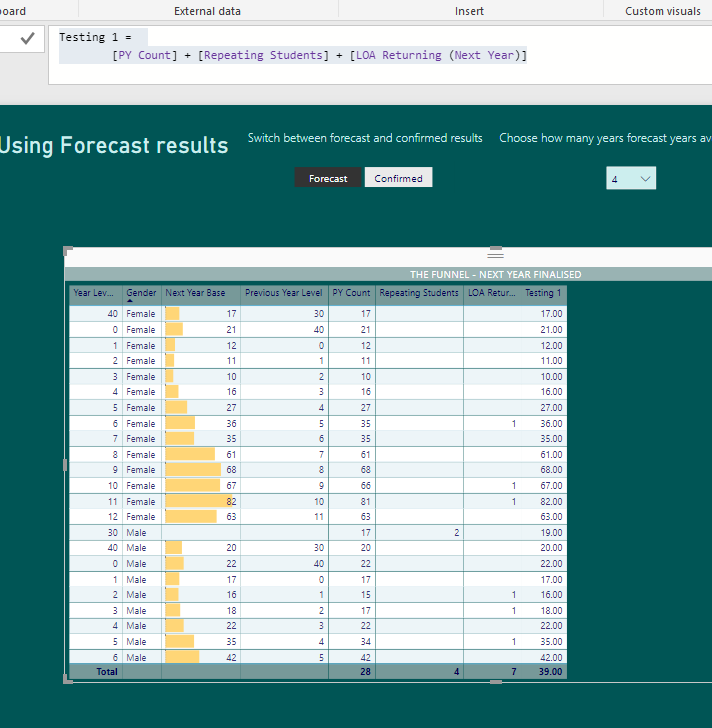
Now that I have refactored the Next Year Base measure I am back to this problem. It is demonstrated on the testing tab.

I think this is having flow on effects to my branching measures.

Next year base is defined as

Next Year Base = 
IF( 
    ISBLANK( [Previous Year Level] ),
    BLANK(),
    [PY Count] + [Repeating Students] + [LOA Returning (Next Year)]
)

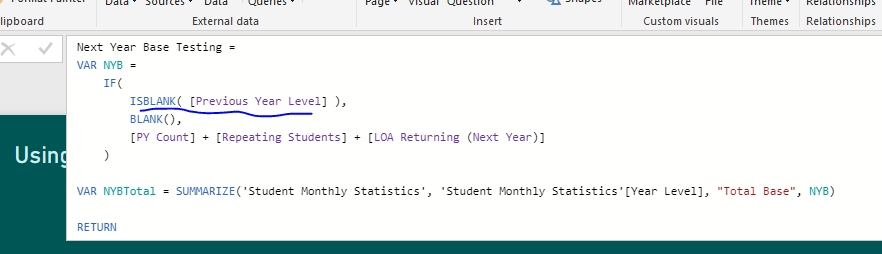
The normal way to make it calculate the total at the bottom is

Next Year Base Testing = 
VAR NYB = 
    IF( 
        ISBLANK( [Previous Year Level] ),
        BLANK(),
        [PY Count] + [Repeating Students] + [LOA Returning (Next Year)]
    )

VAR NYBTotal = SUMMARIZE('Student Monthly Statistics', 'Student Monthly Statistics'[Year Level], "Total Base", NYB)

RETURN

IF(
    HASONEVALUE('Student Monthly Statistics'[Year Level]) || HASONEVALUE(Gender[Gender]),
    NYB,
    SUMX(NYBTotal,[Total Base])
)

This is not working. No total
image

I suspect that measure that branch from that also have no total.

It is something to do with the way the blanks are handled.

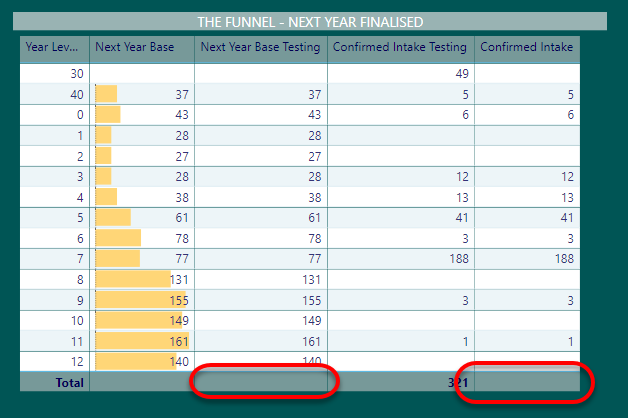
Confirmed Intake Testing = 
VAR NextYearValue = CALCULATE( MAX(Dates[Year]), ALLSELECTED(Dates) ) + 1
RETURN
CALCULATE(
    [Count Future Status],
    FILTER(
        'Future Student Status',
        RELATED('Future Status Lookup'[Synergy Meaning]) = "FINALISED" &&
            'Future Student Status'[Future Enrol Year] = NextYearValue
    )
)

works, but there is an item in the row where there is a blank next year, so I added an IF

Confirmed Intake = 
VAR NextYearValue = CALCULATE( MAX(Dates[Year]), ALLSELECTED(Dates) ) + 1
VAR Intake = 
    IF(
        [Next Year Base] = BLANK(),
        BLANK(),
        CALCULATE(
            [Count Future Status],
            FILTER(
                'Future Student Status',
                RELATED('Future Status Lookup'[Synergy Meaning]) = "FINALISED" &&
                    'Future Student Status'[Future Enrol Year] = NextYearValue
            )
        )
    )
VAR Total = SUMMARIZE('Future Student Status', 'Future Student Status'[Future Enrol Year], "Enrol Total", Intake)

RETURN
IF(
    HASONEVALUE('Year Levels Lookup'[Year Level]) || HASONEVALUE(Gender[Gender]),
    Intake,
    SUMX(Total, [Enrol Total])
)

The calculation breaks.

Since this is the base for all my measures, I really need this to work correctly.
Fun.pbix (1.3 MB)

I’m just gong to have to advise you on this.

By having everything inside variables here I think is a mistake. It’s making it so difficult to audit your numbers.

I would break down each individual part here into separate measures and really test each result to truly understand where the problem is around the totals and stack them in a table.

You need to review each one by one.

I see the model is very slow now also. I would likely say it has to do with the model being so complicated now. Has it always been like this? Or is this the bug where the model changes shape?

Not sure if your formulas are taking a long time to update, but for me they are taking way to long and consumers will get frustrated no end.

This is going to be impossible for someone to audit like this. I’m struggling again now also.

I’ve broken things out and seem to get a calculation just by using this formula

Testing 1 = 
        [PY Count] + [Repeating Students] + [LOA Returning (Next Year)]

Not sure if it’s correct but it’s a start

The reason no results was appearing earlier was because of this.

There is no previous year level in the total, so it’s always evaluating to blank()

Chrs

Hi,
So frustrated about that bug with the model changing shape.
If should look like this

It will look like this until I close the file.

The speed is also becoming an issue. Hence the reason I needed to have an optimised model. I now have close to a million rows of data in my model (for testing). Still only 1/10 of production and it is getting too slow.

I have tried the different measures as well. It makes it really hard to track where I am with hundreds of measures.

I will have a look at your test.

Thanks

Ok cool, looks good. Yes that bug is crazy annoying.

Sounds like the data is going to be a little big if it’s going to get to 10M. Maybe need to optimize that somehow?

Once you have this nailed I would think hard about starting from scratch and simplifying as much as possible.

I’ve done this a few times, it doesn’t actually take that long because all your key formula’s are worked out and you only need to copy and paste them over to a new model.

This way you can build up from scratch without any carry over from redundant info or measures in this model.

Something to think about anyway.

Hi Sam,

I have investigated your statement but have not been able to reproduce it. Previous year level is a valid measure and evaluates correctly in every context. The only time it is blank is for the year level of 30. This is where I want the blank to be passed along.

Previous Year Level is used in the measure [PY Count] so it is in the calculation.

To test I use the DAX:

Next Year Base without blank = [PY Count] + [Repeating Students] + [LOA Returning (Next Year)]

image
As can be seen the results are correct. The blank is where I expect it. The total is completely wrong

But it’s also blank it the total, that’s the major issue here isn’t it because the totals aren’t working?

Hi,
Right - I see what you are getting at. This presents an interesting conundrum. I need the total, but not the blanks in the table.

Not sure of the workaround.

My first thought is to try

Next Year Base Testing = 
VAR NYB = 
    IF( 
        AND(ISBLANK([Previous Year Level]) , HASONEVALUE('Year Levels Lookup'[Previous Year Level])),
        BLANK(),
        [PY Count]
    )

VAR NYBTotal = SUMMARIZE('Student Monthly Statistics', 'Student Monthly Statistics'[Year Level], "Total Base", NYB)

RETURN

IF(
    HASONEVALUE('Student Monthly Statistics'[Year Level]),
    NYB,
    SUMX(NYBTotal,[Total Base])
)

The idea is if the previous year level has only one value (ie in the table and not the total) then use the blank, otherwise use the count, but it still does not work. I suspect the problem is more wide spread.

ISFILTERED is the one you need.

Should be IF( AND( ISFILTERED( Years Lookup…), ISBLANK(…

Try that.

I think you need to also look into this part as well [LOA Returning (Next Year)]

There was some complexity hiding in there from memory that could possibly be simplified.

Hi Sam,
I had to go back and fix a lot of the cumulative measures as well.

The main problem was back in the PY Count Measure rather than the Next Year Base

I have updated these to:

PY Count = 
VAR PY = [Previous Year Level]
VAR ProcessDates = VALUES( 'Student Monthly Statistics'[Process Date] )
VAR StudentGender = [Student Gender]

VAR SingleGenderPY = 
    IF(
        AND(ISBLANK(PY) , ISFILTERED('Year Levels Lookup'[Year Level Code])),
        BLANK(),    
        CALCULATE( 
            [EOY Forecast], 
            FILTER( 
                ALLSELECTED( 'Student Monthly Statistics' ), 
                'Student Monthly Statistics'[Year Level] = PY && 'Student Monthly Statistics'[Gender] = StudentGender
            ), 
            ProcessDates 
        )
    )
     
VAR MultiGenderPY = 
    IF(
        AND(ISBLANK(PY) , ISFILTERED('Year Levels Lookup'[Year Level Code])),
        BLANK(),    
        CALCULATE( 
            [EOY Forecast], 
            FILTER( 
                ALLSELECTED( 'Student Monthly Statistics' ), 
                'Student Monthly Statistics'[Year Level] = PY
            ), 
            ProcessDates
        )
    )
        
VAR PYCount =  
    IF(
        HASONEVALUE(Gender[Gender]),
        SingleGenderPY,
        MultiGenderPY    
    ) 

VAR PYTotal = SUMMARIZE('Student Monthly Statistics', 'Student Monthly Statistics'[Year Level], "Prev Total", PYCount)
RETURN

IF(HASONEVALUE('Student Monthly Statistics'[Year Level]),
    PYCount,
    SUMX(PYTotal, [Prev Total])
)

Next Year Base = 
VAR NYBTotal = SUMMARIZE('Student Monthly Statistics', 'Student Monthly Statistics'[Year Level], "Total Base", [PY Count])
RETURN
IF( 
    HASONEVALUE('Student Monthly Statistics'[Year Level] ),
    [PY Count],
    SUMX(NYBTotal, [Total Base])
)

I feel that the performance issues are caused by all the virtual tables that have been added inside the measures to assist with the summary totals. Nearly every measure has at least one. These are just layering on top of each other and this is slowing the whole thing down.

I cannot see a way around it - not with the level of complexity required in this model (10 different fact tables - all with different date spans that have to be aligned programmatically)

Ok great.

Yes it’s not easy with so much data. I would say it’s a combination of both the data size and the formula complexity.

Measures in Power BI generally work very fast, but if they have to iterate over millions of rows its a little slower.

For me it always comes down to simplification. I do this where ever possible. Sometimes it’s easier than other times.

I would have a good think about testing some things here, by starting from scratch and just placing one formula in after the other.

What I do find with models that blow out in performance and size, it’s actually quite hard to bring it back in the same model without starting again. Somewhere in the model is just seems to retain a lot of meta data (or something like this) and it’s hard to get rid of it without a restart.

I usually don’t find starting from scratch takes that long because you’ve done all the hard work with the logic.

Sam