Measures not calculating sum in matrix

Hello all
I have a fact table from a school that contains student information for each student for each day over the last 10 years. Approximately 1000 records per day over 10 years. I have filtered this in Query Editor to look at only the records for the last day of the month for EOM statistics.

I have created measures to Count Students / boys / girls

///
    Count Students = COUNT('Student Monthly Statistics'[Student ID])
    Count Girls = 
    CALCULATE([Count Students],
        'Student Monthly Statistics'[Gender] = "F")
///

What I need to do is project the starting number of students for the next year. This is based on using the Previous Year Value to find the current total as a starting value.
Naturally, for the earliest year level there is no previous year level (blank).
I am using the SELECTEDVALUE function for this

///
Next Year Base Girls = 
VAR
    SelectedPreviousYearLevel = SELECTEDVALUE('Student Monthly Statistics'[Previous Year Level])
RETURN
IF (ISBLANK(SelectedPreviousYearLevel), 
    BLANK(),
    CALCULATE(
        [Count Girls],
        FILTER(
            ALLSELECTED('Student Monthly Statistics'),
            NOT ISBLANK(SelectedPreviousYearLevel) &&
                SelectedPreviousYearLevel = 'Student Monthly Statistics'[Year Level]
        )
    )
)
///

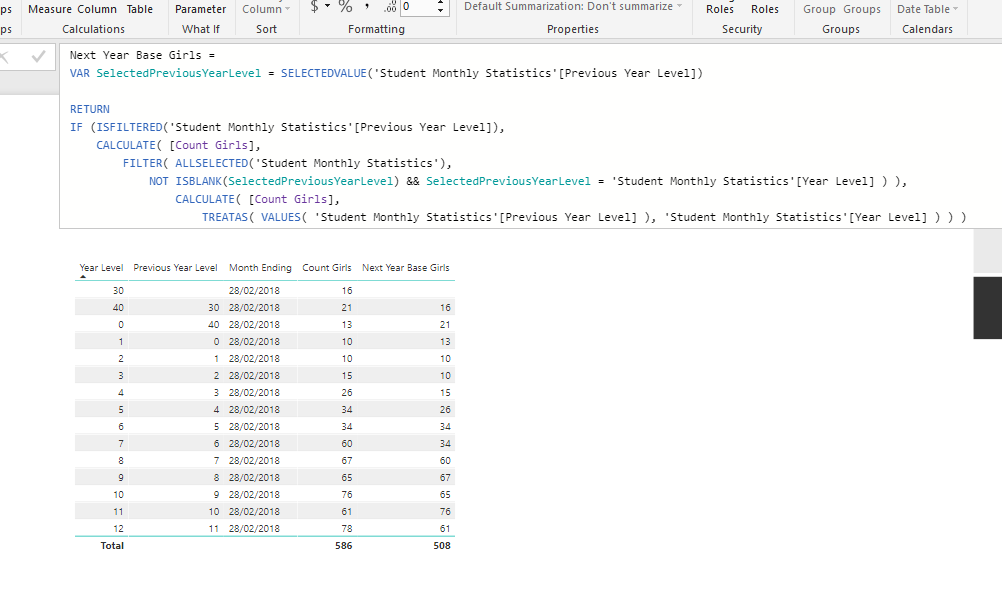
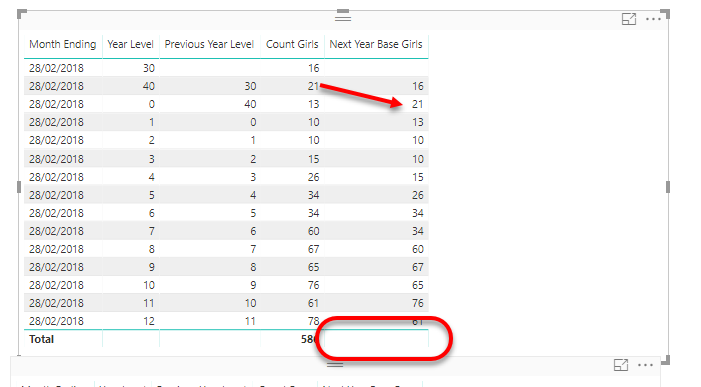
This has resulted in the following table

As can be seen, the count has been brought forward from the previous year level and the first row is empty as expected. What is missing is the total at the bottom.

The question is how can I get this sum as I need it? I suspect the problem is in the use of the SELECTEDVALUE function.

Thanks
I’m a bit confused about the initial context of that formula. Why is the month ending column all the same?

I think your FILTER statement doesn’t need to be like that.

You can probably just use

FILTER(
 ALL('Student Monthly Statistics'),
                SelectedPreviousYearLevel = 'Student Monthly Statistics'[Year Level] )

I’m not 100% sure though, can you send me you desktop file so I can test things. The Month column isn’t making much sense as I can’t see what’s happening in the model behind the scenes.

Hi Sam,
Thanks for the fast response.
The forum does not allow the uploading of the file so I have emailed it to you directly.
The month ending all the same is because I have used a slicer to filter for that specific month. I want to focus on what that month will look like - future visualisations will show how that changes over time and how enrolments / students leaving affects outcomes for the next year but I need to get the base right.

Thanks

Ok thanks.

Few things I did to solve it. Was just re-arranged the model a little bit. This always makes it easier for me to understand what’s happening.

Then I made sure the month end column was a date format (it was text)

Try this formula below I think it works.

There’s a bit to it especially around the TREATAS, but it’s about as clean as can be I think

Next Year Base Girls = 
VAR SelectedPreviousYearLevel = SELECTEDVALUE('Student Monthly Statistics'[Previous Year Level])

RETURN
IF (ISFILTERED('Student Monthly Statistics'[Previous Year Level]), 
    CALCULATE( [Count Girls],
        FILTER( ALLSELECTED('Student Monthly Statistics'),
            NOT ISBLANK(SelectedPreviousYearLevel) && SelectedPreviousYearLevel = 'Student Monthly Statistics'[Year Level] ) ),
                CALCULATE( [Count Girls],
                    TREATAS( VALUES( 'Student Monthly Statistics'[Previous Year Level] ), 'Student Monthly Statistics'[Year Level] ) ) )

Hi Sam,
Thanks for the reply.
For whatever reason (I think it is a version thing) my model positioning will not save. Annoying the life out of me.
Good spotting the date format. I missed that.
I am looking into the TREATAS formula. I have not used that before, but it appears to do the job.
Thanks for your help

Yes I’ve heard of this before, it’s quite annoying I Know.

This usage of TREATAS is really unique but I love it. So clean.

Check out this tutorial for one way you can use TREATAS -

Hi Sam,
Thanks for your response on this.
I have needed to change the model a bit as it grew more complex and have moved the calculation column for the ‘Previous Year Level’ from the fact table to one of the ‘Year Level’ lookup table. It is much more efficient that way.

I would have thought that it would be a simple matter of substituting the new columns in but the result was not at all what I expected.

My new formula is as follows:

Next Year Base Girls = 
VAR
    SelectedPreviousYearLevel = SELECTEDVALUE('Year Level'[Previous Year Level])
RETURN
IF (ISFILTERED('Year Level'[Previous Year Level]), 
     CALCULATE(
        [Count Girls],
        FILTER(
            ALLSELECTED('Student Monthly Statistics'),
            NOT ISBLANK(SelectedPreviousYearLevel) && SelectedPreviousYearLevel = 'Student Monthly Statistics'[Year Level]
        )
    ),
   CALCULATE(
        [Count Girls],
        TREATAS(
            VALUES('Year Level'[Previous Year Level]),
            'Student Monthly Statistics'[Year Level]
        )
    )
)

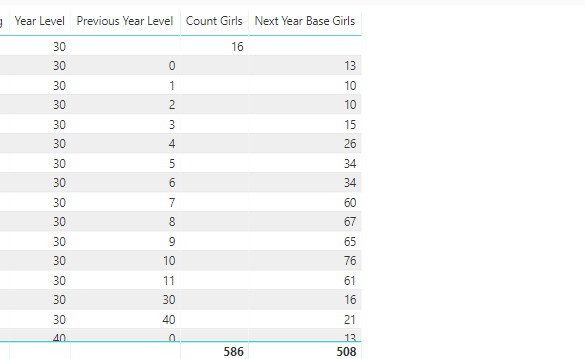
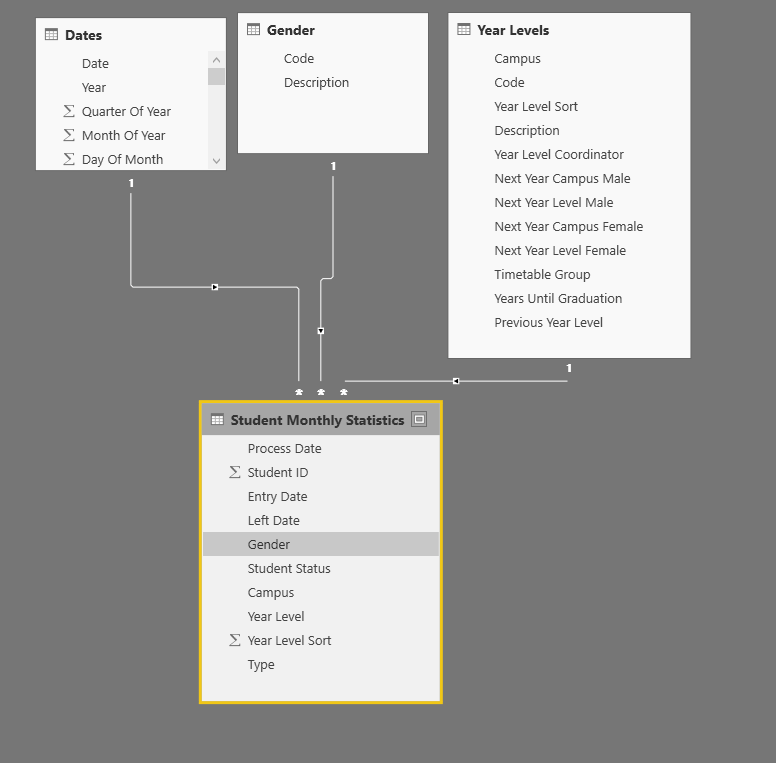
I am clearly missing something in the context here though as instead of getting one line per year level I am getting multiple (13 x 13 - a factorial)
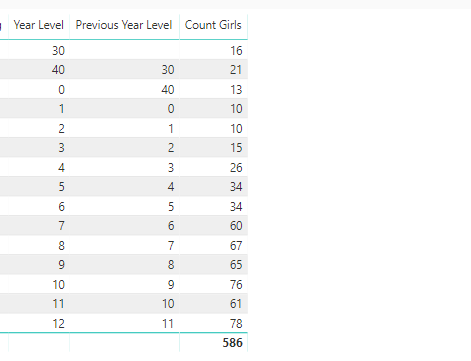
Without the next year base column
image

to with the next year base column
image

Not sure what I am missing.
Thanks

Just a side not on formatting for DAX formulas in post - https://forum.enterprisedna.co/t/how-place-dax-formula-into-forum-topics-posts/156/3

It’s definitely is something to do with the context.

Have you reviewed every filter/dimension you’ve placed into the table here and what it could be doing to the calculation.

Because you know have a relationship between your lookup and you fact, this is maybe what’s playing up.

There probably a bit too much going on here for me to really get a good picture in my mind. I would have to see and test it.

TREATAS can be quite complex and behaviour can be determined by many things so it’s important to get a visual on all those things.

Can you just spend a bit of time trying to understand what’s happening in the initial context of the calculation. Just think through one step at a time and see if anything become clearer.

Chrs

Hi,
I have stripped back the model to the base and discovered that the context error is coming into play in the variable part (SELECTEDVALUE). As soon as this is used the duplication is coming in.

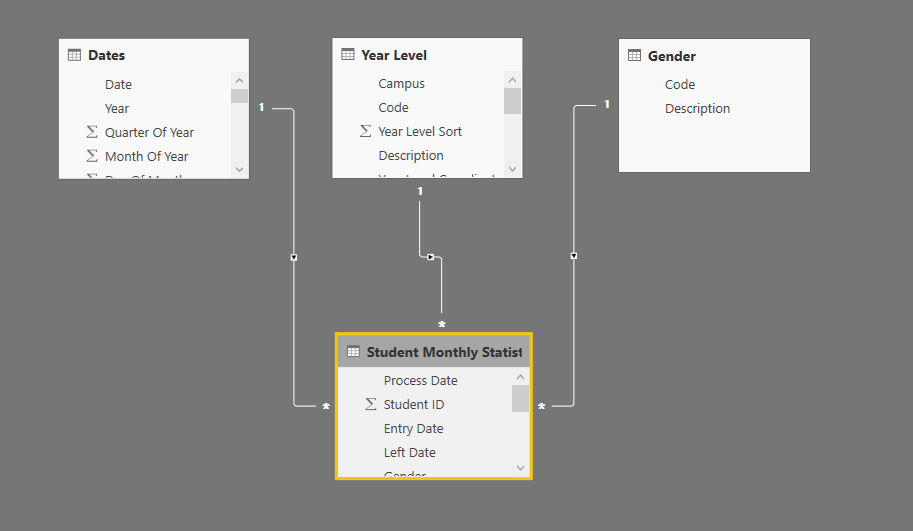
To summarise. The model now look like this:

Basic measures:
    Count Students = COUNT('Student Monthly Statistics'[Student ID])
    Count Girls = 
    CALCULATE([Count Students],
        'Student Monthly Statistics'[Gender] = "F")
    Next Year Base Girls = 
    VAR
        SelectedPreviousYearLevel = SELECTEDVALUE('Year Levels'[Previous Year Level])
    RETURN
    IF (ISFILTERED('Year Levels'[Previous Year Level]), 
        CALCULATE(
            [Count Girls],
            FILTER(
                ALLSELECTED('Student Monthly Statistics'),
                NOT ISBLANK(SelectedPreviousYearLevel) && SelectedPreviousYearLevel = 'Student Monthly Statistics'[Year Level]
            )
        ),
        CALCULATE(
            [Count Girls],
            TREATAS(
                VALUES('Year Levels'[Previous Year Level]), 
                'Student Monthly Statistics'[Year Level]
            )
        )
    )

I don’t believe I can use the SELECTEDVALUE function to determine the value of the previous year level in the table in the same way that I have been previously using it. I need to use a different function.

I am thinking that I need to change the filter to use an ALLEXCEPT Year Level and then match the year level = previous year level but I’m not getting a scalar result doing that.

I have sent you the updated file
Thanks

The reason why the table expands is because of the context in the table. Specifically the Previous Year Level column.

Based on the model you can’t do this, because the previous year now sits in the lookup table and it is not filtered by anything from the date table which is where month ending comes from

image

It can’t work back up the relationship here.

So for every year level it’s now iterating through every previous year.

Based on the model there no DAX formula that will solve this.

What was the reason for breaking these out again? Seemed to be ok before?

Hi Sam,
In the more complex model I need to use the previous year level as a filter in another fact table.
Also, my test model only had a few thousand rows. The production system has (potentially) many times more. Calculating columns on fact tables is not very efficient.
Given you above comment, it looks like I’m stuck with inefficiencies.
Thanks

There’s always a way with DAX but I wanted to understand the reasoning a bit more as to why and if that column was absolutely required.

I think we’ll have to think about this differently now.

First I calculated the previous year in a measure

Previous Year Level = 
CALCULATE( SELECTEDVALUE( 'Year Levels'[Previous Year Level] ),
    RELATEDTABLE( 'Student Monthly Statistics' ))

This second part I’m a bit stuck and will have to review again in the morning when I’m a bit fresher.

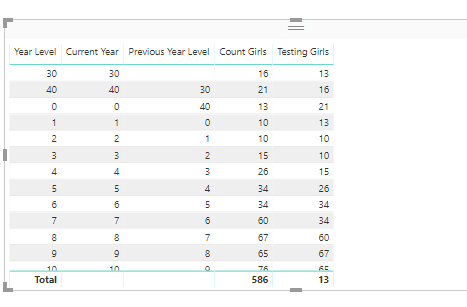
I think the below is close but not quite right.

Testing Girls = 
VAR Previous_Year = [Previous Year Level]

    RETURN
    CALCULATE( [Count Girls],
        FILTER( ALL( 'Student Monthly Statistics'  ),
            'Student Monthly Statistics'[Year Level] = Previous_Year ) )

Just to let you know I’ve been working on a revised solution for a couple of hours now and have to give this a rest for now.

I’ve attempted many different things and just can’t find a solution at this time.

Can we go with the original for now.

I would like to find a solution but I just have to focus on other things for the next few days.

I’ve left it bookmarked to review later

Thanks

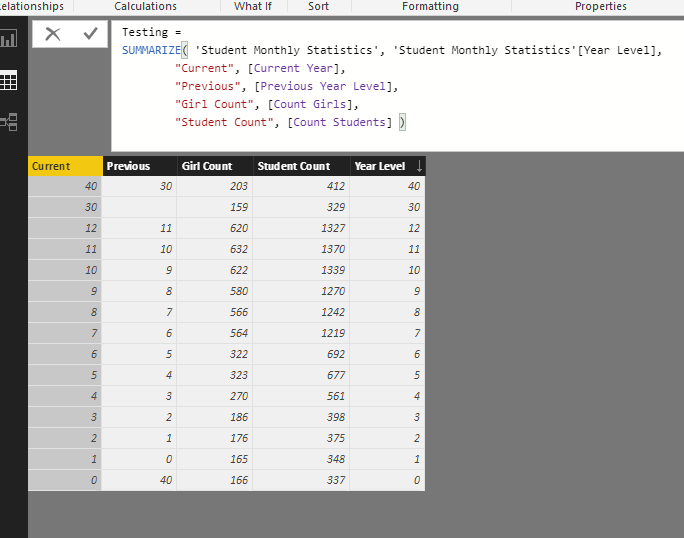
As a side note, this is the main problem.

I’m attempting to build a virtual table to run the calcs, but it seems to be not be taken the date filter into account, which is making the overall numbers incorrect.

See example below.

This would usually solve it for me but for some reason the count girls in the virtual tables is not evaluating correctly and at the very present time I’m confused as to why not.

From what I can tell is it isn’t picking up the date context anymore, but it should be. That’s the issue right now.

I’ll keep working on it, but for now I have to move on.

Will be in touch in due course.

Thanks

Hi Sam,
Understand and am continuing with the original solution in the meantime.
Thanks

Got it!

Went for a walk, cleared the brain and worked out the solution.

It’s not the cleanest but it works from what I can see. And on reflection this is about as good as it can be I believe.

Virtual tables are the key here.

Testing Girls = 
VAR Previous_Year = [Previous Year Level]
VAR CurrentYear = SELECTEDVALUE( Dates[Year], 0 )
VAR CurrentMonth = SELECTEDVALUE( Dates[Short Month], 0 )

RETURN
SUMX(
    FILTER(
    SUMMARIZE( ALL( 'Student Monthly Statistics' ), 'Student Monthly Statistics'[Year Level], Dates[Year], Dates[Short Month],
        "Current", [Current Year],
        "Previous", [Previous Year Level],
        "Girl Count", [Count Girls] ),
            Dates[Year] = CurrentYear && Dates[Short Month] = CurrentMonth ),
            IF( [Current] = Previous_Year, [Girl Count], BLANK() ) )

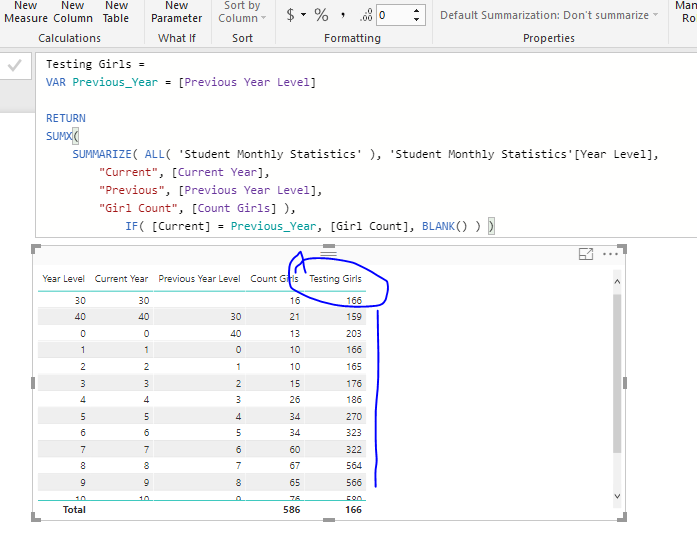
image

Previous Year Level = 
CALCULATE( SELECTEDVALUE( 'Year Levels'[Previous Year Level] ),
    RELATEDTABLE( 'Student Monthly Statistics' ))

It was the date filtering that was the problem, so I worked in the FILTER function which a couple of additional variables.

One other thing, just make sure your Year column is a whole number and not text.

See how you go with this.

Hi Sam,
I can see where you are coming from and agree that the date filter is what was causing the problem.
I do not quite get this result though.

I am not quite sure where your measure for [Current Year] came from.

However, there are a couple of other problems. Firstly, the first row, There is no previous year for the first row. So, where does the “13” come from? Also, the cumulative total at the bottom is wrong.

This should be easy. I just want to take the previous year’s cumulative count and make that the value. I just cannot find a way to reference the previous row in a summarised table.

This is going to become even more complex when I need to be able to use any date in the table, not just the end of month as I am now.

As mentioned, my test dataset only has 100,000 roes. Production has close to 10 million rows, growing by 2000 rows daily. It has to be efficient.

Thanks

I haven’t forgot about this, just been tied up with other things. I keep looking for a better solution and let you know if I can find it.

Hi Sam,
I think I am going to have to take it as it is as am running out of time. I need to have this finished by the middle of this month and have a lot to do.
Based on this result, I have the next interesting challenge.

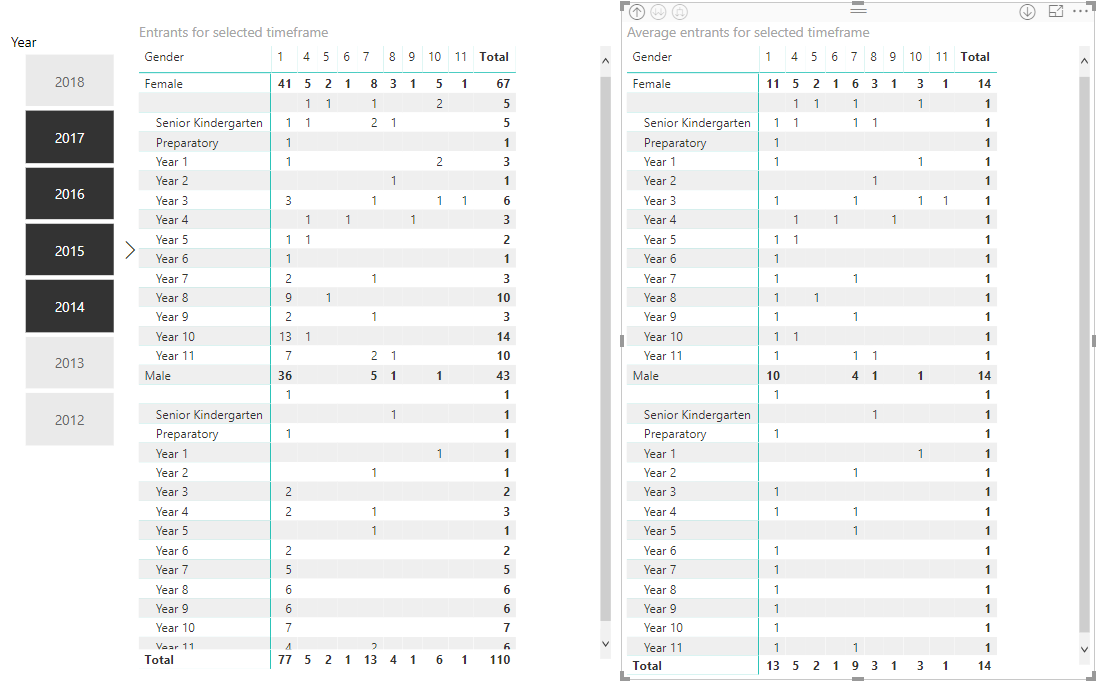
I have a second fact table, this time regarding historical entrant data. I have summarised that into a matrix quite happily and even got a correct sum at the bottom thanks to your getting the totals correct. (Didn’t quite get the line totals right but I don’t need them).

Note that is using a different year filter from the other calculations. I might need to remove this and put it in the actual measures as a parameter to make it work properly .

The left matrix is the raw summarised results over the time-frame selected, in this case the four years.
image
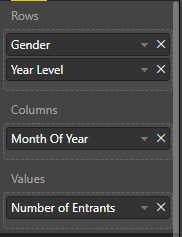
Number of Entrants is defined as
Number of Entrants = COUNT('Average Entrance Excel'[ID])

The right matrix is the averaged results over the same time-frame. The columns along the top are months of the year. The missing ones are where there is no data. This is correct.
image
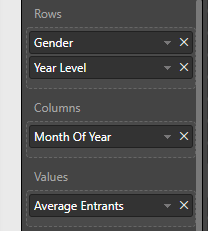
The DAX for that is:

Average Entrants = 
   VAR MonthlyAverage = AVERAGEX('Average Entrance Excel', [Number of Entrants])
   VAR AverageTotal = SUMMARIZE( 'Average Entrance Excel', 'Average Entrance Excel'[Year Level], "Monthly Avg", MonthlyAverage)

   RETURN

   IF(
       HASONEVALUE('Average Entrance Excel'[Year Level]),
       MonthlyAverage,
       SUMX(AverageTotal, [Monthly Avg])
   )

My first challenge is that i need to create a cumulative to the end of year total of averages for each month. The normal cumulative pattern breaks down here.
That is, for say Senior Kinder, Jan = 1, Feb =1 , Mar = 1, Apr = 2, etc

Then, I need to somehow reference that cumulative total for that month back in my original function that we are working so hard on.

This is only the start. I will need to do something similar to this at least a dozen more times. Once I have the pattern I should be OK.
Thanks