Measures not calculating sum in matrix

Hi Sam,
Good news.
I managed to get the first part - the cumulative average based on your tutorial ‘Cumulative sales based on monthly average’

Cumulative Average Entrants = 
VAR MinDate = CALCULATE(MIN(Dates[Date]), ALLSELECTED(Dates))
VAR MaxDate = CALCULATE(MAX(Dates[Date]), ALLSELECTED(Dates))
VAR DateRange = FILTER(
                    ALL(Dates),
                    Dates[Date] >= MinDate && Dates[Date] <= MaxDate
                )
                            
RETURN

SUMX(
    FILTER(
        SUMMARIZE(
            DateRange, Dates[Month Name],
            "Av Entrants", [Average Entrants],
            "MonthNumber", MIN(Dates[Month Of Year])
        ),
        [MonthNumber] <= MAX(Dates[Month Of Year])
    ),
    [Av Entrants]
)

That just leaves the fun part - how do I reference a specific row and column. Obviously I won’t be referencing the cell or the row or column, but the Power BI equivalent.

Thanks

Yes sorry about this, honestly this one has been doing my head in. I’ve spent a lot of time on it and just can’t understand why it’s not working as I believe it should.

I like that solution you have for the cumulative total though. Do you get that from this tutorial?

Ok I’ve rewired the brain and trying to work this out once and for all

I’m close but the total isn’t correct at the moment.

This is where I’m at.

Previous Year Level = 
CALCULATE( MIN( 'Year Levels'[Previous Year Level] ), RELATEDTABLE( 'Student Monthly Statistics' )) 

PY Boys = 
VAR PY = [Previous Year Level]
VAR ProcessDates = VALUES( 'Student Monthly Statistics'[Process Date] )

RETURN
IF( ISBLANK( [Previous Year Level] ), BLANK(),
    CALCULATE( [Count Boys],
        FILTER( ALL( 'Student Monthly Statistics' ),
             'Student Monthly Statistics'[Year Level] = PY ),
                ProcessDates ) )

This gets me to here

The total is the issue now.

I’m still investigating

I’m stumped and need to break for the evening. Will attempt again tomorrow.

I’ve upgraded the formula a bit to this

PY Boys = 
VAR PY = [Previous Year Level]
VAR ProcessDates = VALUES( 'Student Monthly Statistics'[Process Date] )
VAR PYCount = CALCULATE( [Count Boys], FILTER( ALL( 'Student Monthly Statistics' ), 'Student Monthly Statistics'[Year Level] = PY ), ProcessDates )

RETURN
IF( ISBLANK( [Previous Year Level] ),
    BLANK(),
         PYCount )

Totals still not correct though yet

Hi Sam
The tutorial was ‘Cumulative sales based on monthly average’ from the Advanced DAX Combinations section of the courseware. I don’t think it is on YouTube. The totals was from the course you mentioned.
Thanks

Hi Sam,
Reviewing the latest effort on the previous year level and I can see where you are coming from but, as you said, the total is still not coming through. We may need to do something similar to create a virtual table to get the column total.

I have basically parked that problem for now as I have a working solution, even if it is not efficient. I really need to concentrate on the other problem, that of bringing the summarised second fact table information back into the first table.

I see two (potential) problems in the setup. The first is that the date ranges are different. That is, for the student statistic summary I am looking at a single month. For the entrant summary I need to look at four years. Right now I have two date filters on two different pages to manage that. I suspect this is one thing that is tripping me up and I will need to overcome that by adding a date range context to each of the parts to calculate the cumulative total.

The second problem is one of relationship. There is no (direct) relationship between the two fact tables. They share the same lookup tables but that doesn’t help me reference values across tables.


I am kind of stumped here and running out of time and ideas
Thanks

So I’ve worked out how to show the correct total.

It’s not ideal as maybe you want this is the same formula, but if you use what I’ve show you in previous post then overlay this formula you can get the correct totals also.

Py Boys Overlay = 
SUMX(
    SUMMARIZE( 'Student Monthly Statistics', 'Student Monthly Statistics'[Year Level],
        "Boys", [PY Boys] ),
            [Boys] )

See below for it all laid out

Ok onto the next one. I’m reviewing this

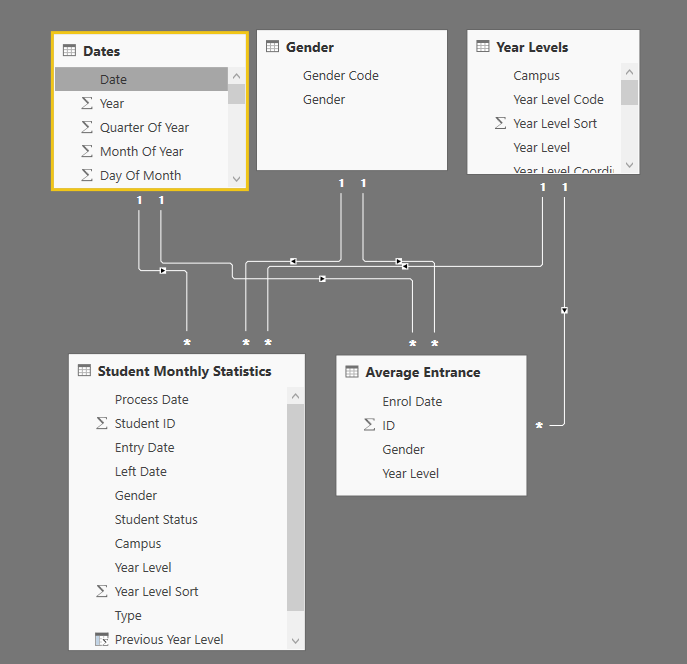
Ok based on the current model you should be able to showcase data across the two table together. You’ll just need to get the filters working correctly and as you want them to be.

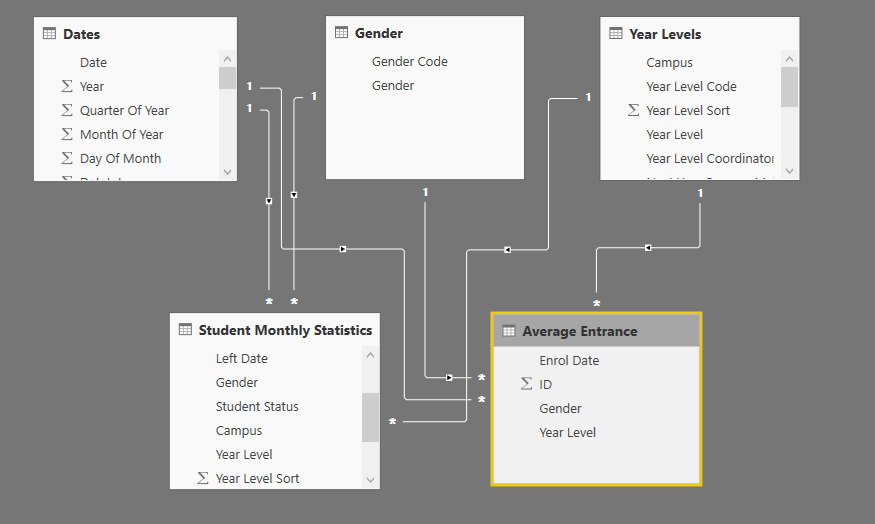
The biggest hurdle is the dates relationships, where the Student Monthly Statistics is filtered by Process Date and the Average Entrance by Enrol Date.

This is the main thing that needs to be managed well.

We can manage it though it’s just about getting the correct filters and formulas together and truly understanding the context to every calculated result.

It’s my preference not to have slicers work across pages, especially with this type of setup and multiple dates.

There is a reasonable chance a consumer would get confused on not understand the context of the calc if filters are being placed over calculations that can’t be seen.

I really highly recommend not doing this.

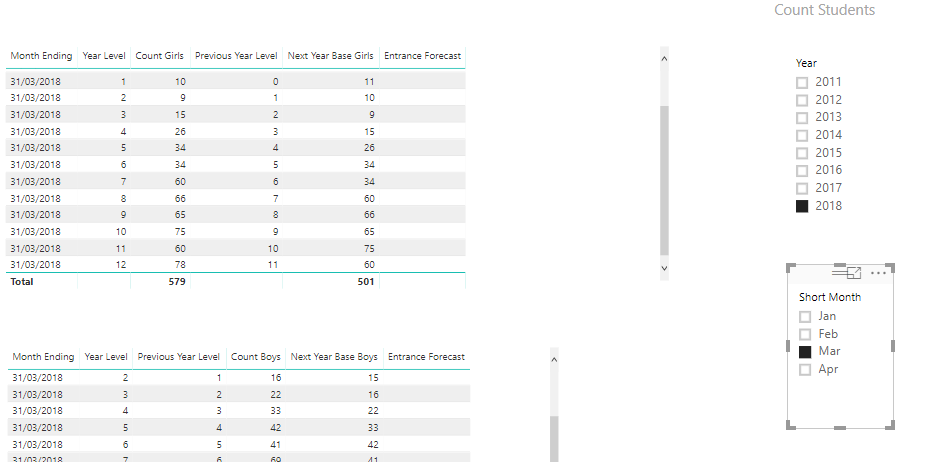
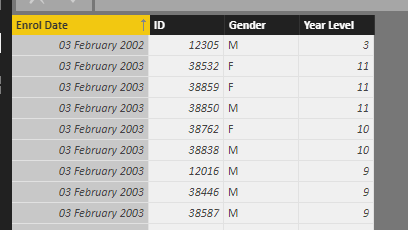
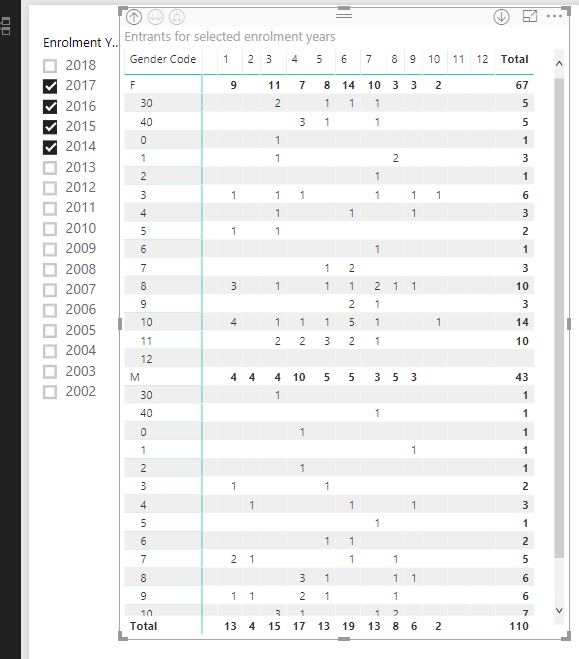
Also on any page make sure you can see everything filtered as well. Like with the below it’s hard to even know 2018 is filtered.

image

When mocking things up I always find this very important to understand the behaviour of eveyrthing

I’m reading your email and looking at this

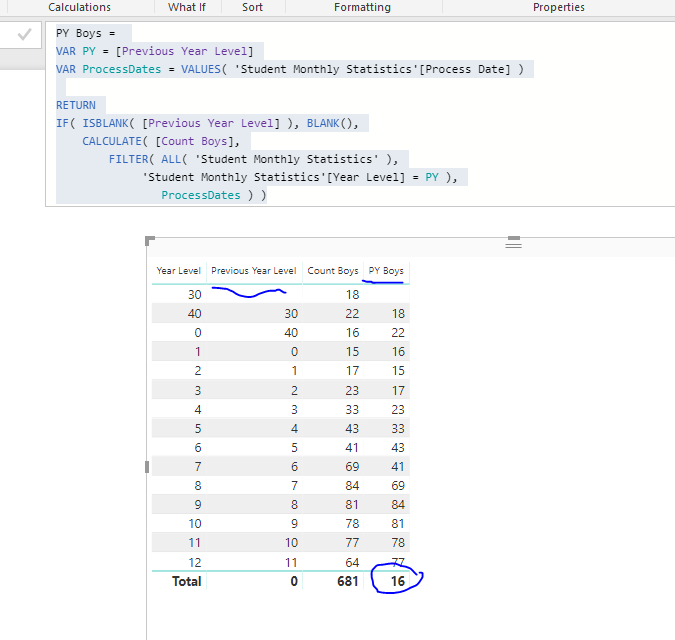
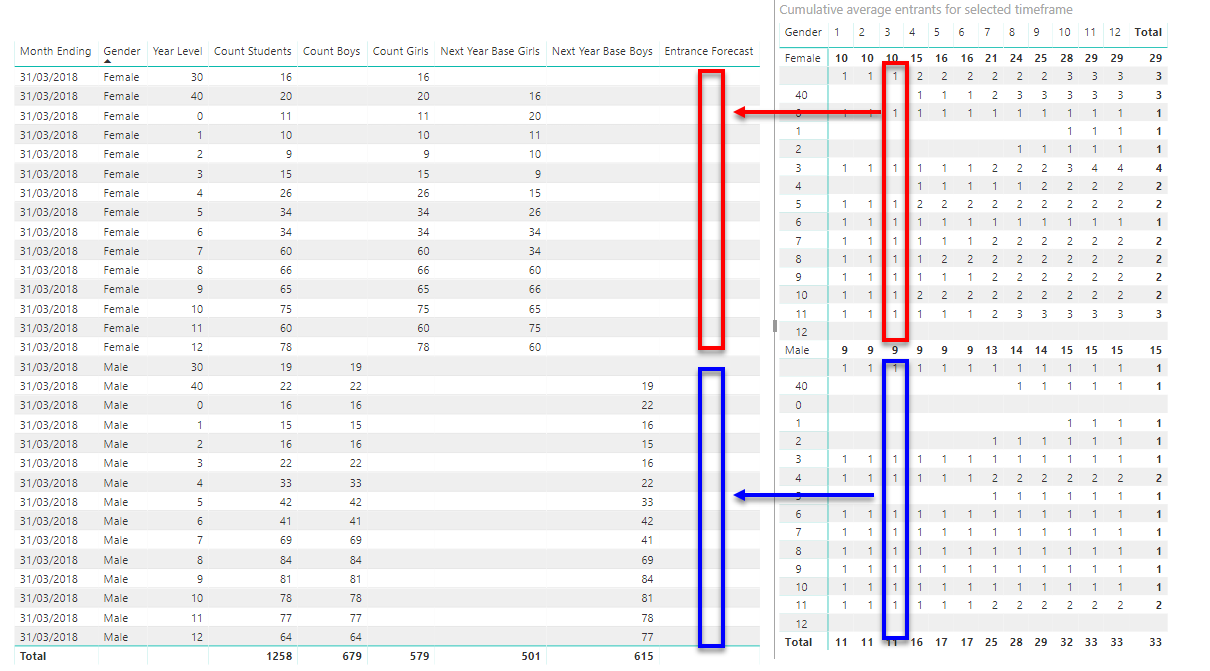
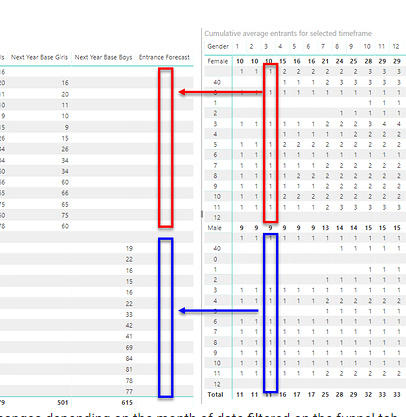
What I need to do is get the year level, gender and month value into the correct column on the “Funnel” page where the month is determined by the slicer.

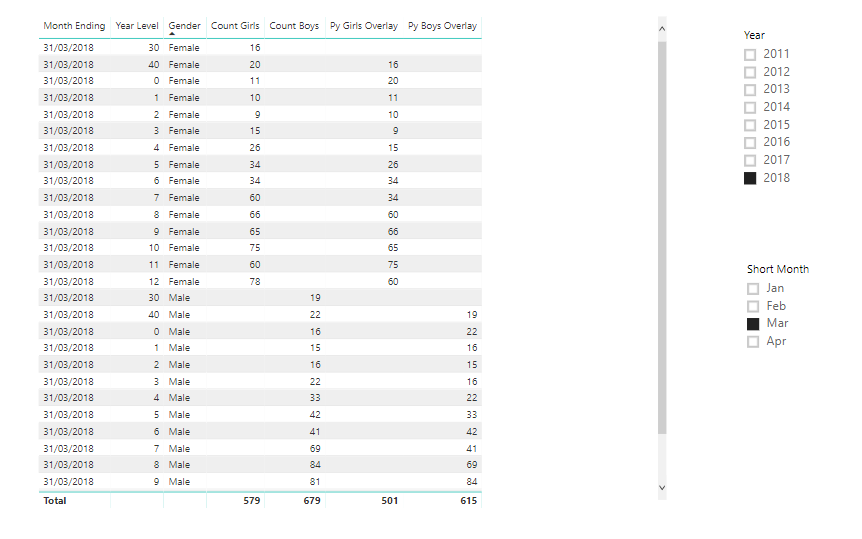
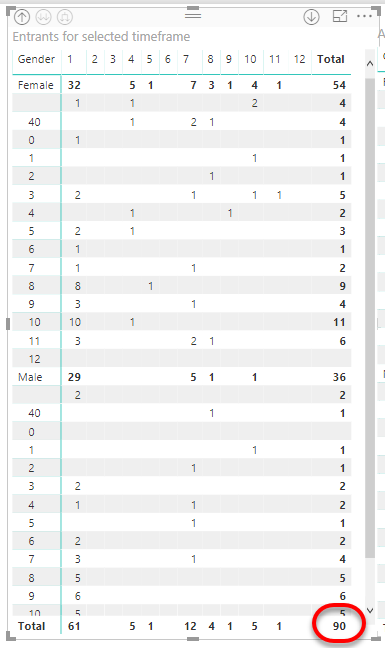
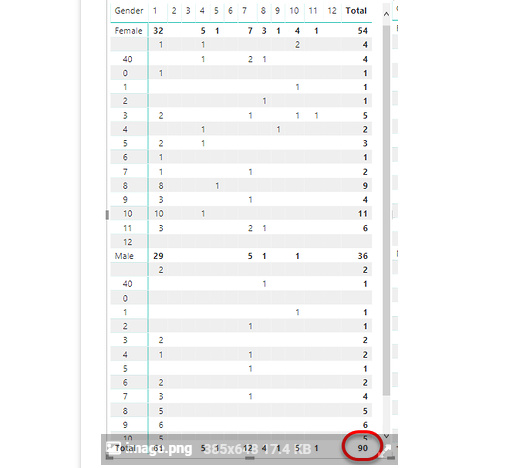
I’ve added Gender in here and seems to be ok. Is that what you’re looking for?

I do see it does present some issues with other calculations but is this what you’re attempting to do?
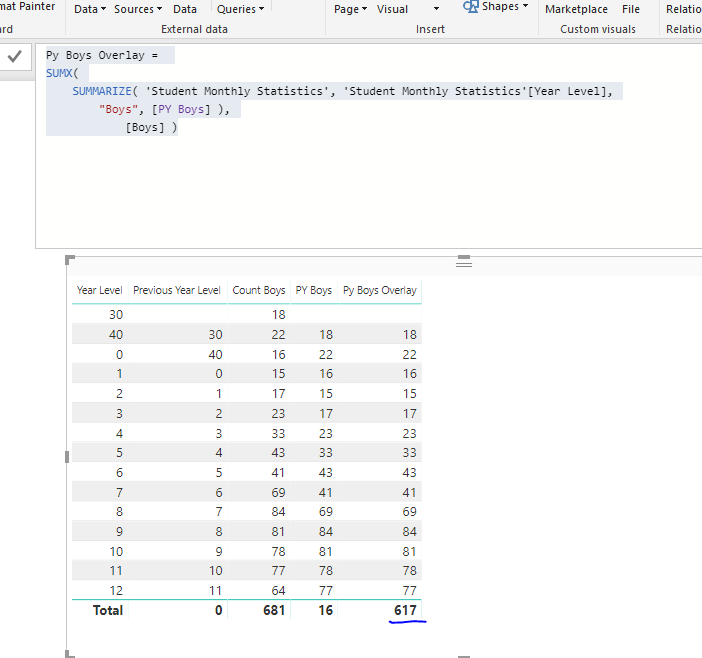
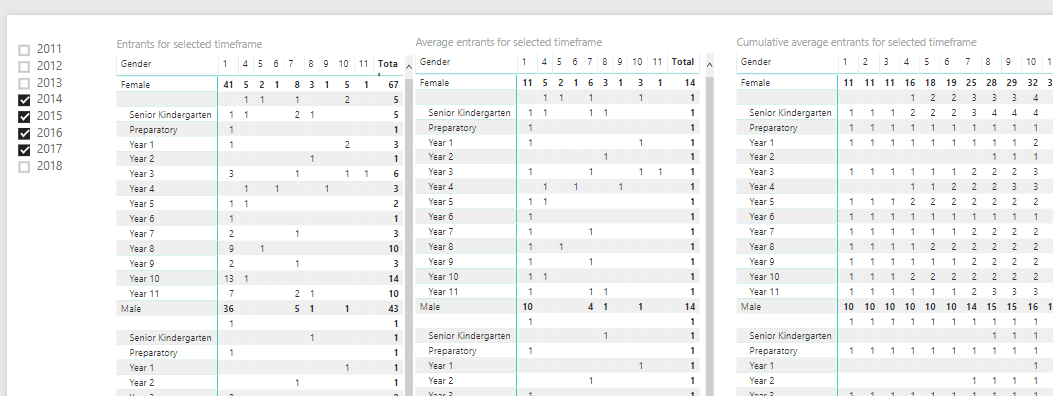
With this as well…

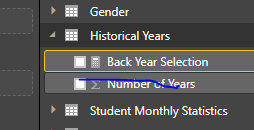
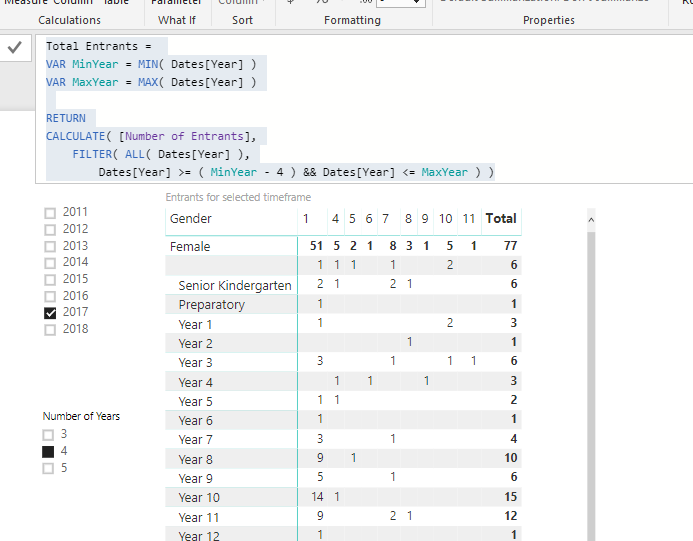
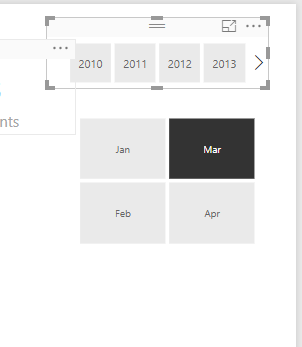
I am suspecting that what I need to do is remove the date slicer from the average entrance page and somehow link it up to the date slicer on the funnel page, but modified by the parameter “Number of Years” from the historical years parameter table. That way I can choose 2018 in the funnel page and have that flow onto the average entrance results for 2014 - 2018 where the number of years = 4

I’m just confused around the complexity of this, and not sure how to proceed. I just don’t feel it need to be this complex and can be simplified immensely.

I’m trying my best to get solutions out here, but I’m a bit lost of where to go to next.

My feel is that this needs to be simplified where possible. The data model isn’t actually that complex and can be managed. The hardest part is managing the data context and I think when this is understood well then this actually shouldn’t be too tough.

Here’s the latest on where I have the table at for this. I think all the results are correct and the totals are also correct. I’ll also list every formula that works up to this also.

Please see the model attached as well.

Fun.pbix (698.9 KB)

Previous Year Level = 
CALCULATE( 
    SELECTEDVALUE( 'Year Levels'[Previous Year Level] ),
    RELATEDTABLE( 'Student Monthly Statistics' )
)


PY Boys = 
VAR PY = [Previous Year Level]
VAR ProcessDates = VALUES( 'Student Monthly Statistics'[Process Date] )
VAR PYCount = CALCULATE( [Count Boys], FILTER( ALL( 'Student Monthly Statistics' ), 'Student Monthly Statistics'[Year Level] = PY ), ProcessDates )

RETURN
IF( OR ( ISBLANK( [Previous Year Level] ), SELECTEDVALUE( Gender[Gender] ) <> "Male" ),
    BLANK(),
         PYCount )


Py Boys Overlay = 
SUMX(
    SUMMARIZE( 'Student Monthly Statistics', 'Student Monthly Statistics'[Year Level], 'Student Monthly Statistics'[Gender],
        "Boys", [PY Boys] ),
            [Boys] )


PY Girls = 
VAR PY = [Previous Year Level]
VAR ProcessDates = VALUES( 'Student Monthly Statistics'[Process Date] )
VAR PYCount = CALCULATE( [Count Girls], FILTER( ALL( 'Student Monthly Statistics' ), 'Student Monthly Statistics'[Year Level] = PY ), ProcessDates )

RETURN
IF( OR ( ISBLANK( [Previous Year Level] ), SELECTEDVALUE( Gender[Gender] ) <> "Female" ),
    BLANK(),
         PYCount )


Py Girls Overlay = 
SUMX(
    SUMMARIZE( 'Student Monthly Statistics', 'Student Monthly Statistics'[Year Level], 'Student Monthly Statistics'[Gender],
        "Girls", [PY Girls] ),
            [Girls] )

I’m hoping this is close to what you need.

Chrs
Sam

Hi Sam,
That is really impressive. A lot of work but it will definitely fix the inefficiencies.

To answer your earlier question re the filters across pages. I totally agree. Ideally I would replicate the same filter on the second page and ensure that they are linked.

The difficulty that I am facing with that idea is that I need to get more than the data that is filtered. I need to backdate the filter to include all data for average entrants from the current filter to four years prior.

As far as I can tell that means I will need to add a whole bunch of additional FILTER inside CALCULATE for each of the measures

  • Number of entrants
  • Average entrants
  • Cumulative average entrants

This filter needs to modify the filter to include the four years prior.
I tried,

VAR MinDate = CALCULATE(MIN(Dates[Date]), ALLSELECTED(Dates[Date]))
VAR StartDate = EDATE(MinDate, -([Back Year Selection] * 12))
VAR EndDate = CALCULATE(MAX(Dates[Date]), ALLSELECTED(Dates[Date]))
VAR DateRange = FILTER(
                    ALL(Dates),
                    Dates[Date] >= StartDate && Dates[Date] <= EndDate
                )

RETURN
CALCULATE(
    COUNT('Average Entrance'[ID]),
    DateRange
)

But the result is not right.

Thanks

I don’t feel this is that difficult actually from

I just still haven’t got my head fully around the situation.

In this particular report page you have 4 years filtered, so is this not getting the results you need?

You also know that you don’t actually have ‘Number or Years’ anywhere in the report page so this is [Back Year Selection] evaluating to nothing??

image

When working these out…

Always just start with one. I always find if a can get one, then the others will just happen, then I can focus all my thoughts onto that.

Couple of things I’ve just noticed that you may want to evaluate.

The average entrance table goes back to 2003, but your date table only to 2010

image

So there will be a lot of missing data points there if you need them.

So hopefully I’m understand this correctly here.

You want to select any grouping of year and then work out those years + 4 years prior to the minimum year.

If that’s the case this is how I would do it.

Total Entrants = 
VAR MinYear = MIN( Dates[Year] )
VAR MaxYear = MAX( Dates[Year] )

RETURN
CALCULATE( [Number of Entrants],
    FILTER( ALL( Dates[Year] ),
        Dates[Year] >= ( MinYear - 4 ) && Dates[Year] <= MaxYear ) )

I think this works from what I can tell, but you’ll have to let me know.

I guess you can bring in your back year selection measure as well if you like to this pattern.

Chrs
Sam

Hi Sam
I know about the mismatched dates. At this stage that is not important as I won’t be going back that far. (2018 - 5 = 2013). I plan to actually filter that in the Query Editor later but wanted all the data there for my testing.

I understand what you are referring to when you say the measure is not on the page. That is correct. I created a new page and put it on there for my testing. That is when I got the skew results.

What I want to achieve is this:


where the month column being used changes depending on the month of date filtered on the funnel tab.

Thanks

Hi Sam
I have tried the DAX
It doesn’t give the right totals.
The original where the four years are manually selected


The total is correct with 90 entrants

and the new one where the years are being calculated.


All the results are wrong, most obviously the total.
Thanks

I’m sorry I’m lost now.

There’s two things here and I’m not sure on both of them where to next as I don’t quite understand what’s required exactly.

Can we simplify this somehow.

You’got these arrows pointing to here, but then the calculations are wrong from what I can tell?

image

I also can’t replicate this table?

image

I thought you wanted a calculation that looked at the minimum year and then jumped back 4 year from then?

Hi Sam,
Things have got way more complicated (because they were not complicated enough !)
I was on the understanding that they wanted to use the enrolment date as a basis for all calculations. This was incorrect.

There is another date in the original table that I filtered out - the confirmation date.

This date is what is used to calculate the pivot table months (the confirmation month). I have brought this date back in and created a second relationship. I have just started the process of updating the DAX to use the inactive relationship.

Number of Entrants = 
CALCULATE(
    COUNT('Average Entrance'[ID]),
    USERELATIONSHIP(Dates[Date],'Average Entrance'[Confirmation Date])
)

Still working on the average entrants to get the right average and then the cumulative results - which are currently wrong.

Once I get them right, I need them to be the Entrants Forecast column

Thanks

Ok yes that looks right technique for turning on the inactive relationships

Hi Sam,
Its all good in theory.
I get the number of entrants correct


but the average is up the creek.

Average = 
CALCULATE(
    AVERAGEX('Average Entrance', [Number of Entrants]),
    USERELATIONSHIP(Dates[Date],'Average Entrance'[Confirmation Date])
)

Last I checked 2 / 4 is 0.5 - not 1.0

I’ll need to look at the file.

You can add it to the forum post now

Hi Sam,
I have managed to fix the summary average issue. It was a date context issue. I needed to remove it from the calculation and use the number of years that have been selected.

Now all the summary information is correct. I just have to transpose the cumulative total for the relevant year and month selected into the right area in the main table.

I have uploaded the file Fun.pbix (797.2 KB)

Thanks

Hi Sam,
One more thing I should note. The Enrolment years chosen are the years prior to the year chosen in the funnel.
That is, if I choose Mar 2018, the enrolment years need to be 01/01/2014 - 31/12/2017

Regards