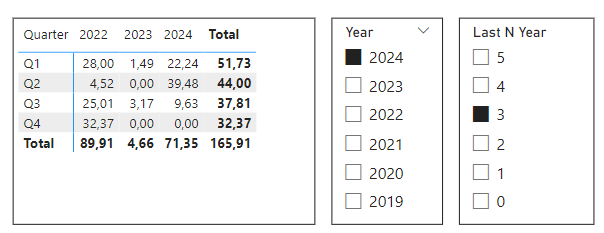
I am working on a project where I want to show something similar but years as horizontal and qtrs as vertical for sales. So want to show 5 years past sales data by qtr depending on which year I select in the slicer.
I will try that but as far as data goes, will I be able to attach my current PBIX file here so you can see (sorry I am new here so not sure how to share that)?
I did created a new date table but still not getting what I am expecting. I created separate measure for each and as long as I am selecting year 2024 from the slicer it’s working fine but as soon as I select any other year, data does flow but headers doesn’t match to data. I attached dummy PBIX file for you to check.
Your solution is much cleaner and easy to follow than what I came up with. Appreciate! I will take this a solution/Answer.
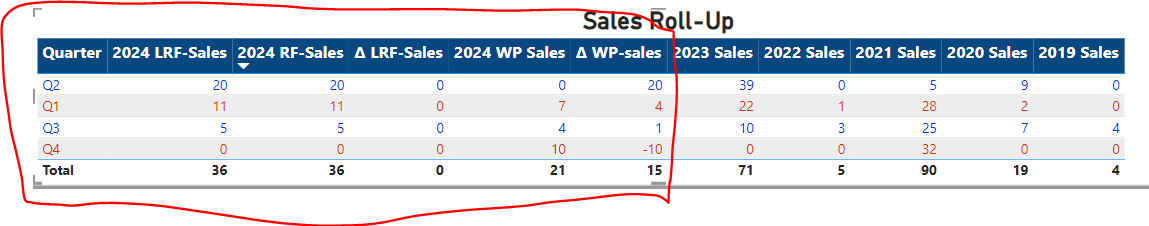
One quick question. How can I make first FIVE columns locked regardless which year is selected from the slicer. E.g.: If someone select 2022, I want to show LRF, CRF, WP (along with differences for the current year).