Hallo,
I have a table visual, where i show, over a period, the average spend per bill, broken down per store.
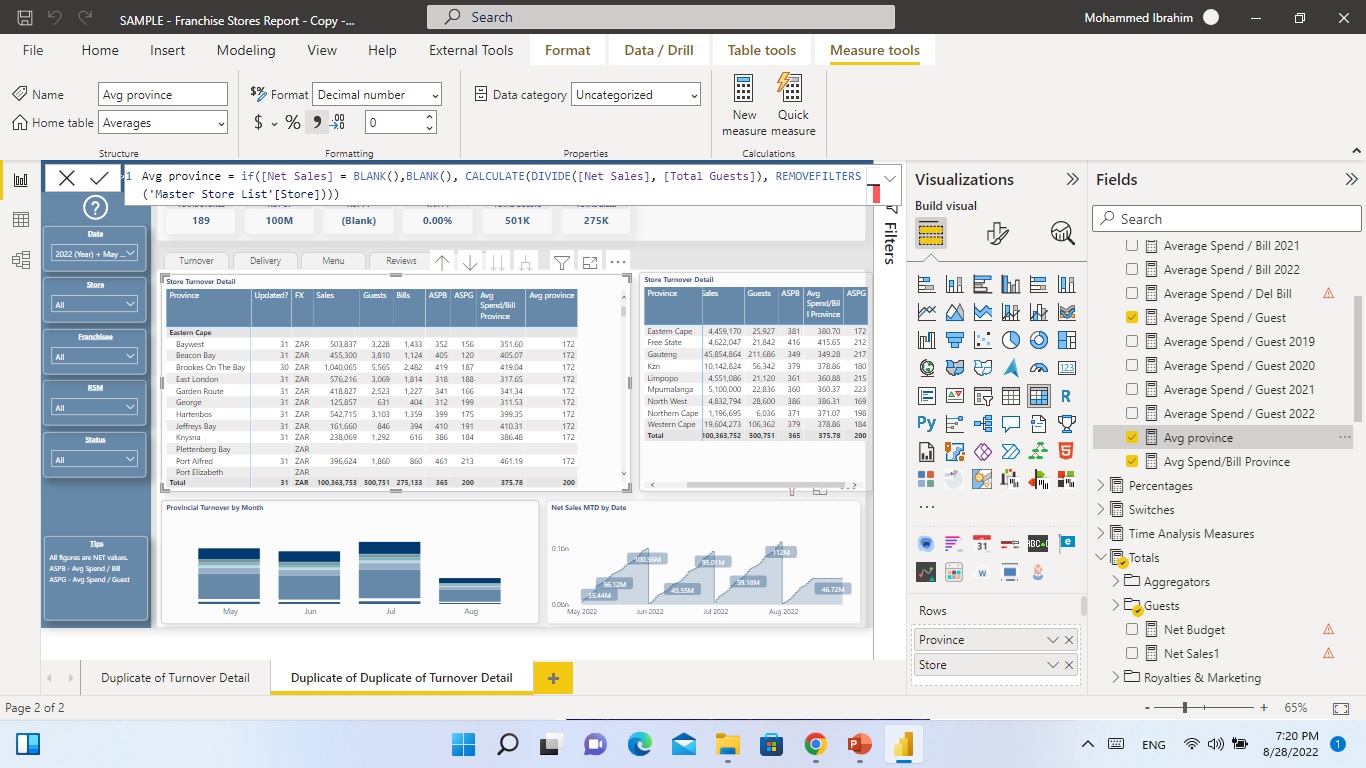
I want to show, within the same visual, the average spend per bill for the selected date, for the region that the store falls in, to compare if it is above or below the average.
My PBIX file is 100mb, and has company data in it (so hard to send - trying to reduce the size)
To explain quickly the table layout:
Master Store List → contains the province, and the ID for the store
Daily Turnover → contains turnover by day for every store in the network. it links to Master Store List via the ID. Values concerned is Net Turnover, Total Transactions.
The average Turnover per Transaction is calculated by dividing Net Turnover with Total Transactions (over a period).
This is shown on a table visual,
On the attached ppt file you will see the visual. I highlighted Gauteng, to show the stores in Gauteng on the left, and you can see, the ASPB/Province is not the same for all the stores (the individual ASPH will be different).
I am struggling with the right DAX formula to put ‘static’ ASPB in the table on the left next to each store, to compare it to see if above or below. The problem i think is because the Province is not in the Turnover store, but in the Master Store List, which is related via the StoreID column. I think this is something simple i am overlooking.
Ive included on the file the formulas i am using too. Hope this helps.
Thanks a mil
Hi Karl,
There is no any attached could you share the ppt file in order to understand your point?
Hi Mohamed, shucks thought i uploaded. here it is again
problem with average per province.pptx (209.7 KB)
As you sent i applied the same you mention at Adventureworks dataset and used the Avg measure as the attached file
let me know if that what you are looking for it and i understood right
problem with average per province.pptx (330.4 KB)
Hi Mohamed, thanks for the reply. I tried the formula, it almost worked. I attached the result though. If you look at the last slide, it shows the result. The thing is, it shows the same average for all the stores. Atterbury, the first line, should be the same as Gauteng on the right column avg. I have drawn 3 lines on the picture to show you. So all Gauteng stores should have the same Provincial avg, and all KZN stores too, and so on.
I’ve included a small set of the actual report for you to see.
Thanks again for the help.
SAMPLE - Franchise Stores Report - Copy.pbix (9.8 MB)
In order to fix this issue you need to add the province at the rows and put under it store to make the measure work but that for now , till i find way to make it without adding province at your sheet and i will get back to you
1 Like
thanks for the assistance. i will also continue digging on this problem
Hi @karlschoeman, did the response provided by @mohamedibrahim help in solving your query? If not, how far did you get and what kind of help you need further? If yes, kindly mark as solution the answer that solved your query.
Hi @karlschoeman , due to inactivity, a response on this post has been tagged as “Solution”. If you have a follow question or concern related to this topic, please remove the Solution tag first by clicking the three dots beside Reply and then untick the check box.
Hi guys, sorry been travelling. I still have not managed to figure out this query though