Hello @vkarthik21,
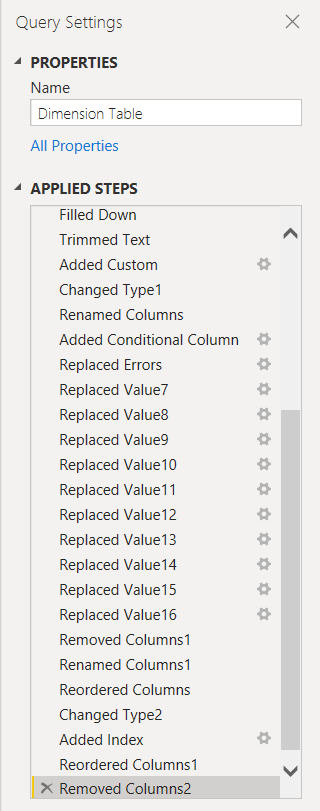
Sure, would be really happy to help you and provide the brief explanation behind the logic that went through. For understanding the steps that’s been applied you can go throught the “Applied Steps” option into the Power Query by clicking onto the individual steps as well as by clicking onto the “Gear Icon” so that you can see what was actually done there.
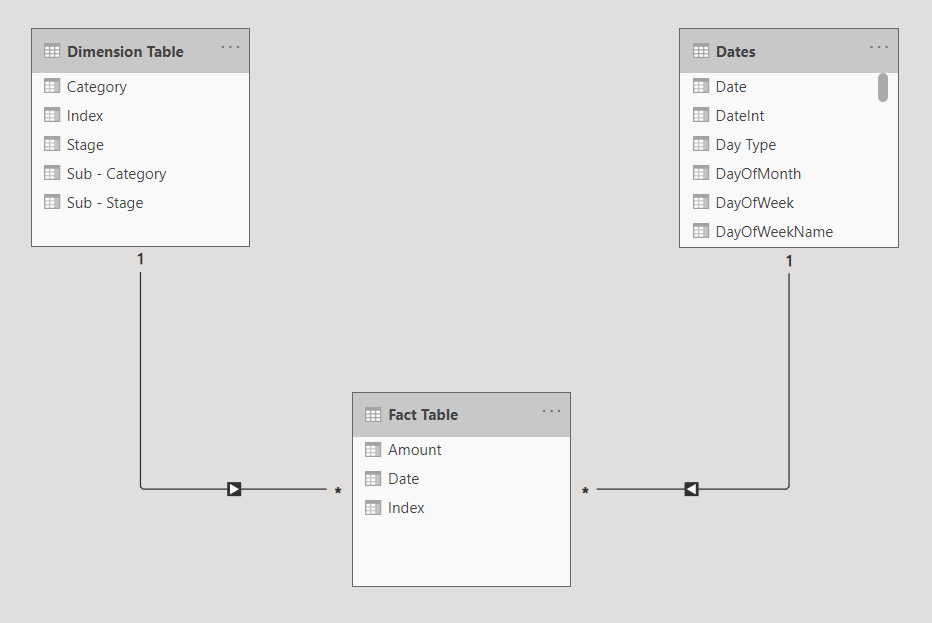
Firstly, the “Fact” and the “Dimension” Table are created by referencing the original table that you had provided into the CSV file. If you want to know what’s referencing you can find a video into the “Data Modelling” course.
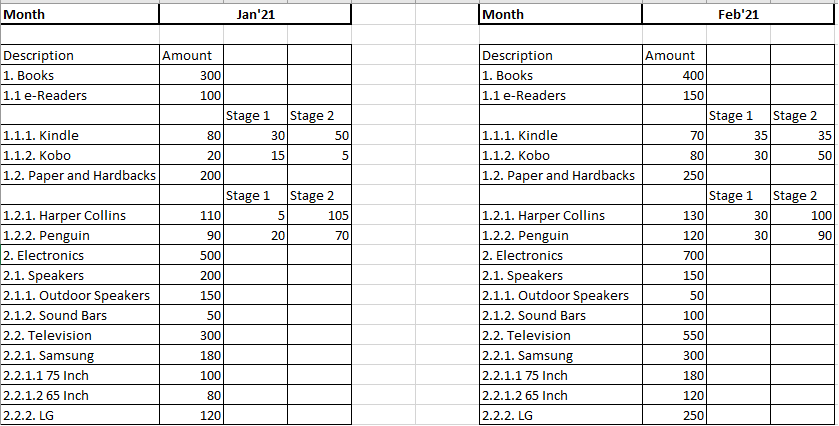
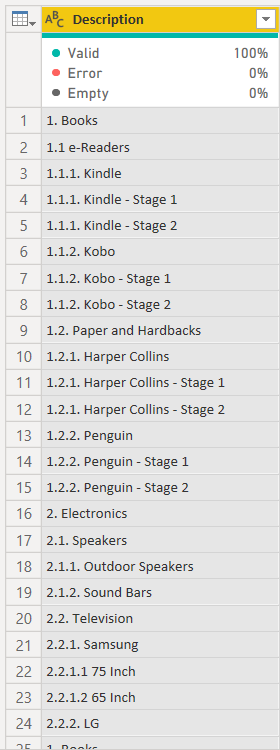
So as you suggested in your initial post that you’ve “Categories”, “Sub-Categories” and “Stages” but than for some only of the cases you also have “Sub-Stages” so this is where it gets trickier. And the minute details of the original table was also very important at the first instance otherwise splitting of the column will provide ambiguous results. In your original table (as you can see from the screenshot provided below) some of the hierarchy numbers ends with symbol - “.”.
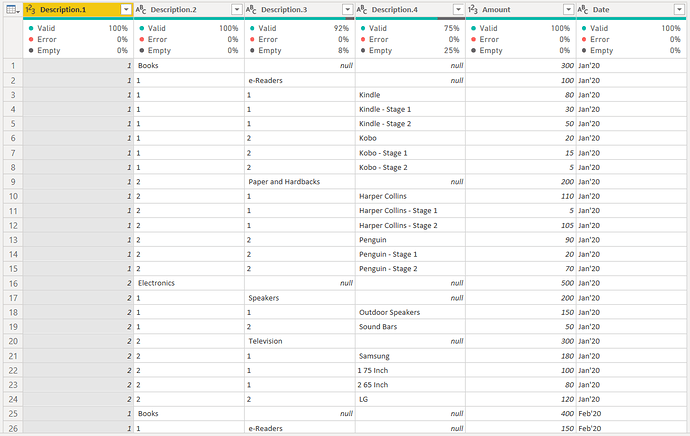
And therefore, it was important to end all the hierarchy numbers with the symbol - “.”. This you can check it out how it was done by going through the “Applied Steps” option. And now since we’ve achieved the consistency into the hierarchy numbers now we’ve to split the column based onto the symbol - “.”. Once the columns are split this is how it’ll look like. Below is the screenshot provided for the reference -
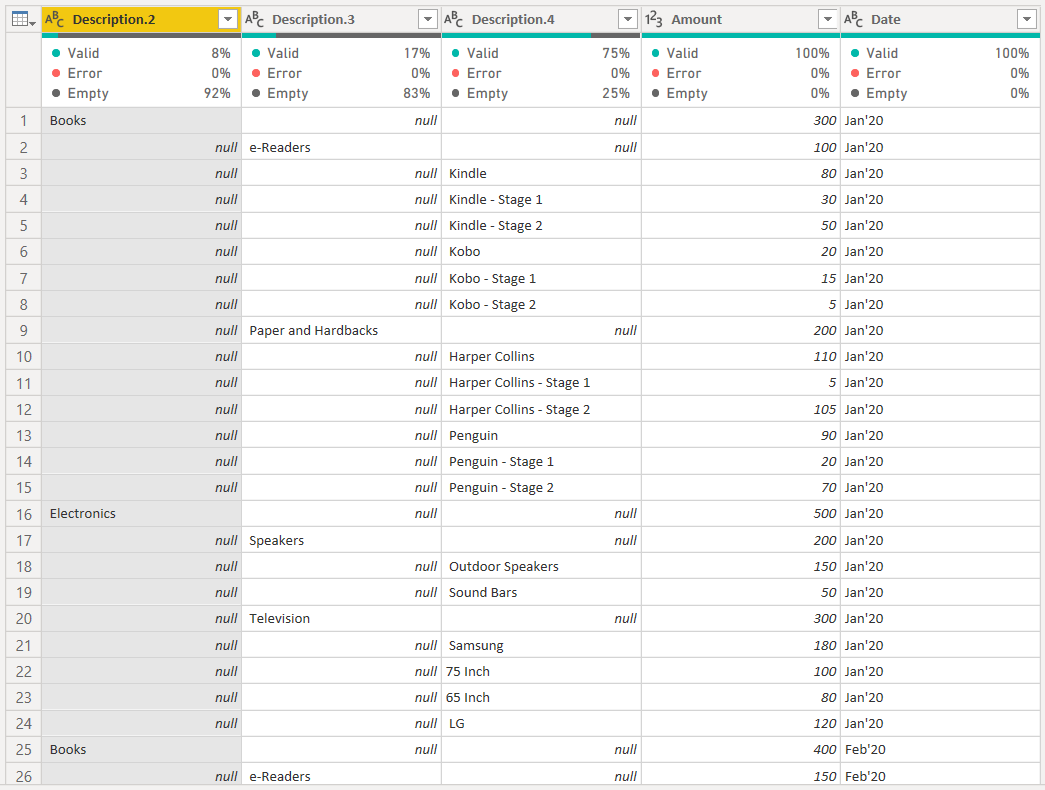
Now, once I split the column I removed some of the un-necessary columns as well as some of the un-necessary data from some of the columns. Again go through the “Applied Steps” option. After removing all the un-necessary things from the table, this is how the table will look like. Below is the screenshot provided for the reference -
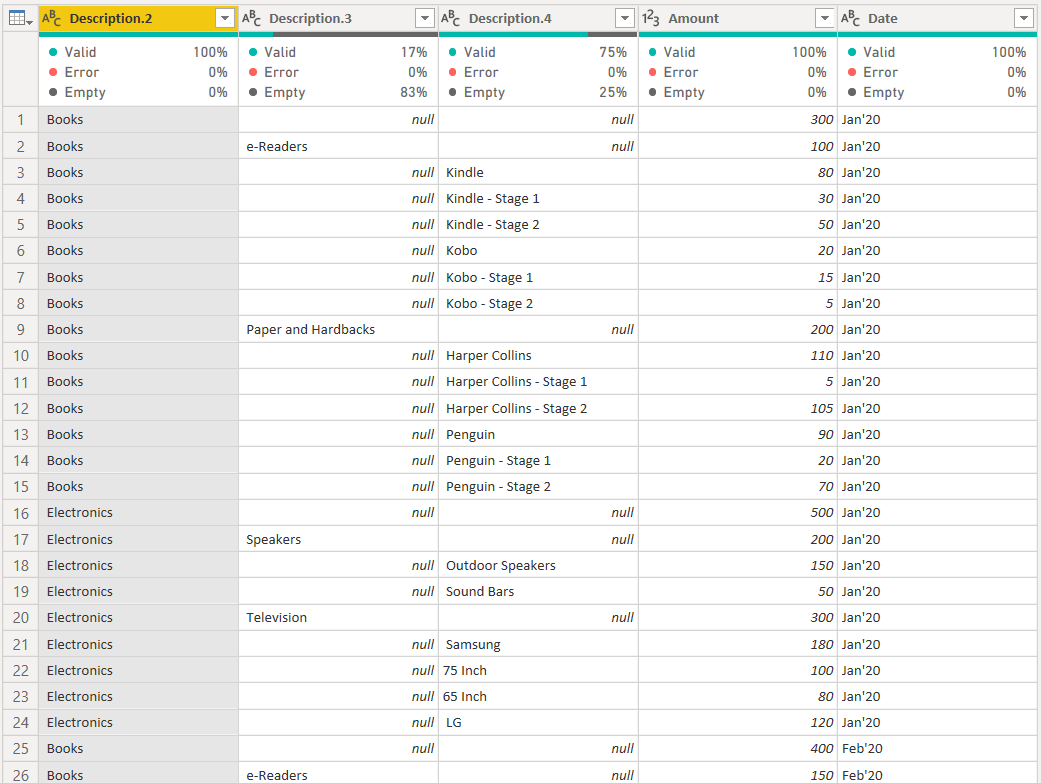
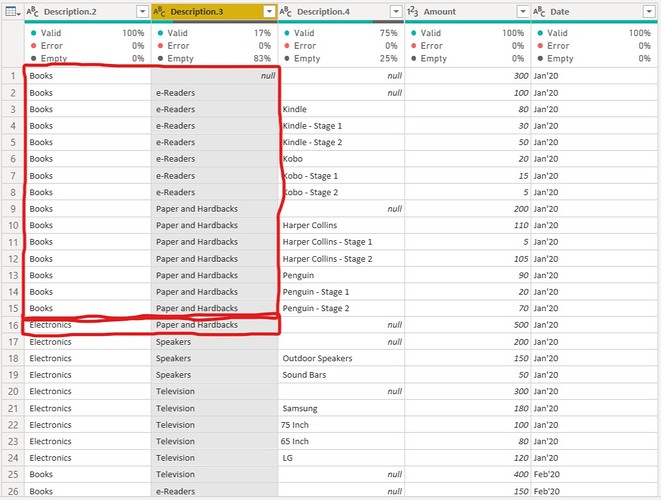
Now, just select the “Description.2” column and right-click on it and use the “Fill Down” option. Below is the result in the form of screenshot of that column provided for the reference.
Now, you must be wondering let’s follow the same process for “Description.3” column as well. Or why I didn’t applied the same steps on “Description.3” column as well. So here’s the screenshot of the result had we followed the same process for “Description.3” column as well.
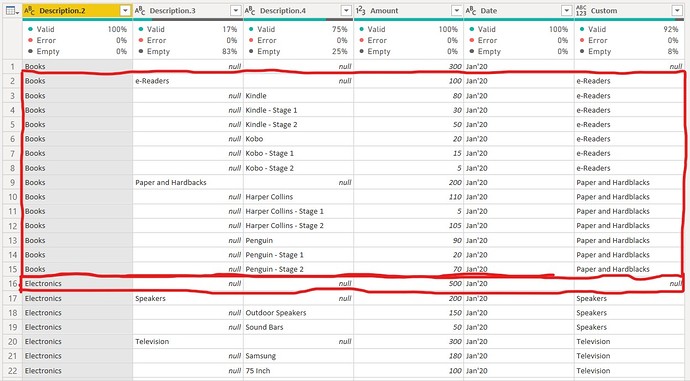
So if you observe first part of the screenshot everything looks good but in the second part you’ll find the error that “Paper and Hardbacks” which is the sub-category of the category “Books” is now getting dragged under the category of “Electronics” part as well. And this is where we need to write the logic of “IF AND ELSE” in the form of “M Code” by adding a “Custom Column” in order to avoid this type of ambiguous results. Below is the M Code provided for the reference -
if [Description.2] = "Books" and [Description.3] = "e-Readers" then "e-Readers" else
if [Description.2] = "Books" and [Description.4] = "Kindle" then "e-Readers" else
if [Description.2] = "Books" and [Description.4] = "Kindle - Stage 1" then "e-Readers" else
if [Description.2] = "Books" and [Description.4] = "Kindle - Stage 2" then "e-Readers" else
if [Description.2] = "Books" and [Description.4] = "Kobo" then "e-Readers" else
if [Description.2] = "Books" and [Description.4] = "Kobo - Stage 1" then "e-Readers" else
if [Description.2] = "Books" and [Description.4] = "Kobo - Stage 2" then "e-Readers" else

if [Description.2] = "Books" and [Description.3] = "Paper and Hardbacks" then "Paper and Hardblacks" else
if [Description.2] = "Books" and [Description.4] = "Harper Collins" then "Paper and Hardblacks" else
if [Description.2] = "Books" and [Description.4] = "Harper Collins - Stage 1" then "Paper and Hardblacks" else
if [Description.2] = "Books" and [Description.4] = "Harper Collins - Stage 2" then "Paper and Hardblacks" else
if [Description.2] = "Books" and [Description.4] = "Penguin" then "Paper and Hardblacks" else
if [Description.2] = "Books" and [Description.4] = "Penguin - Stage 1" then "Paper and Hardblacks" else
if [Description.2] = "Books" and [Description.4] = "Penguin - Stage 2" then "Paper and Hardblacks" else

if [Description.2] = "Electronics" and [Description.3] = "Speakers" then "Speakers" else
if [Description.2] = "Electronics" and [Description.4] = "Outdoor Speakers" then "Speakers" else
if [Description.2] = "Electronics" and [Description.4] = "Sound Bars" then "Speakers" else

if [Description.2] = "Electronics" and [Description.3] = "Television" then "Television" else
if [Description.2] = "Electronics" and [Description.4] = "Samsung" then "Television" else
if [Description.2] = "Electronics" and [Description.4] = "75 Inch" then "Television" else
if [Description.2] = "Electronics" and [Description.4] = "65 Inch" then "Television" else
if [Description.2] = "Electronics" and [Description.4] = "LG" then "Television" else

null)
The logic basically states that -
“If Description.2 column is “Books” and Description.3 is “e-Readers” than result should be “e-Readers” and than since Description.3 column contains the null so now we’ll take help of Description.4 column which also an attribute or sub-part of Description.3 column. And that is, If Description.2 column is “Books” and Description.4 is “Kindle” than result should be “e-Readers” and now keep following this same logic till the very end”.
And this is how the result will look like. Below is the screenshot of the result of “Custom Column” provided for the reference -
And now, in the screenshot you’ll see that “Electronics” is blank for the first line whereas previously it was getting over-lapped with the sub-category “Paper and Hardbacks”.
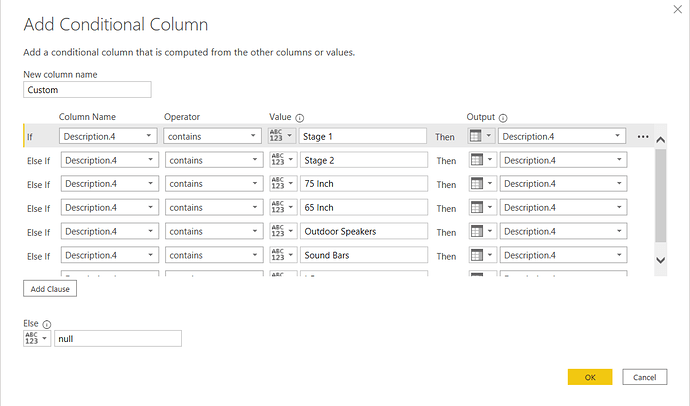
Now, once this is done. We’ll move on towards the last important part. And that is, for some of the Stages you’ve Sub-Stages and for some you don’t have so will add a “Conditional Column” here. So the logic will be like this -
“If you’ve Sub-Stages than provide us the result of Sub-Stages otherwise provide us with the result of Stages. That is, if Description.4 column has a Sub-Stage than provide results of the Description.4 column otherwise provide the results of Description.3 column”.
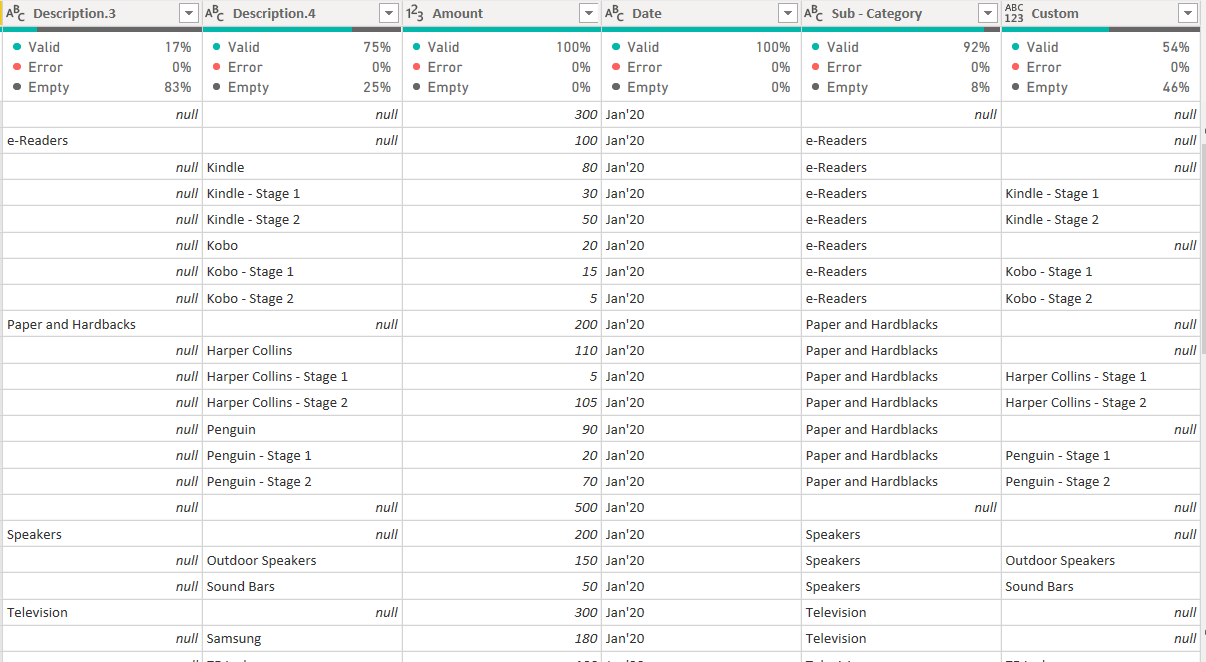
Below is the screenshot provided for the reference of the conditions as well as of the results for the reference (See Custom Column) -
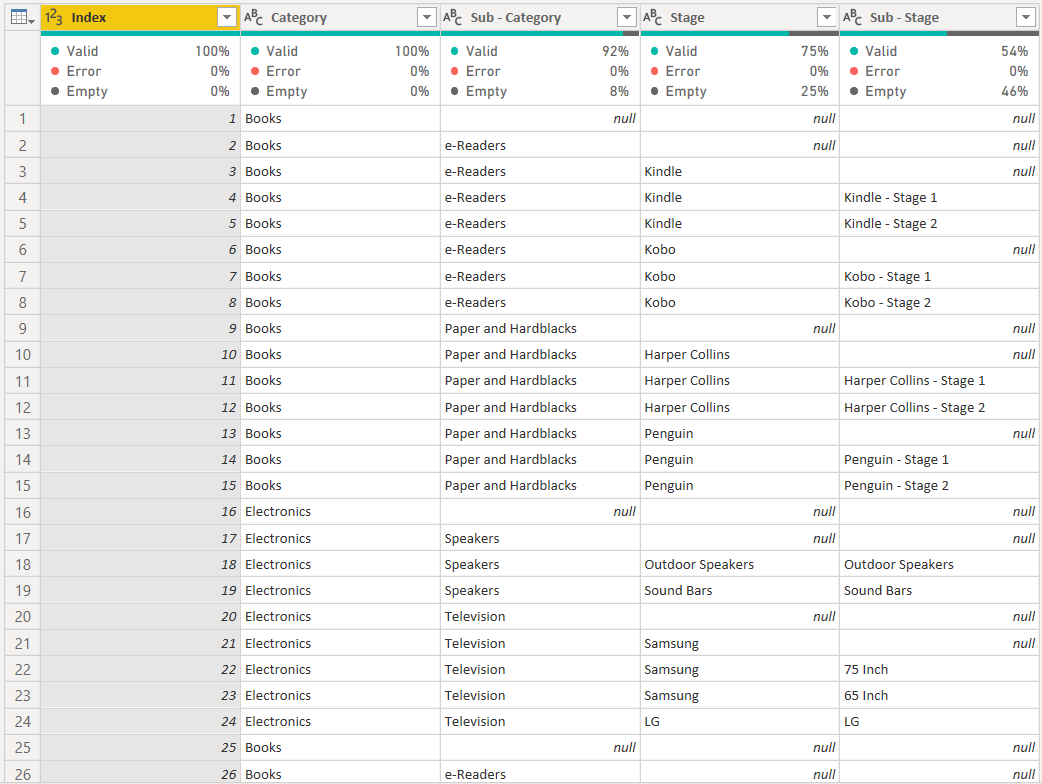
And than lastly since we need to create a relationship between the “Fact” and “Dimension” table I’ve added an “Index Column” into it. And this is how the final result will look like after performing all the transformations -
For Fact table, I’ve applied basic transformation steps and that you can go through those steps throught the “Applied Steps” steps.
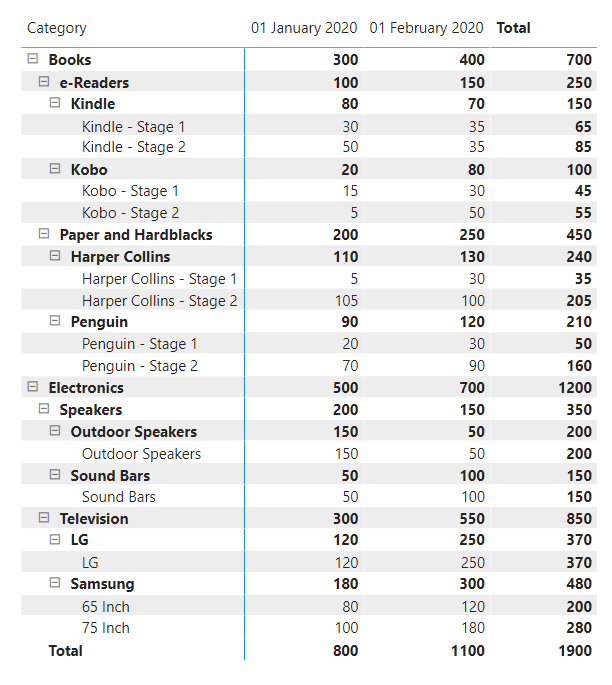
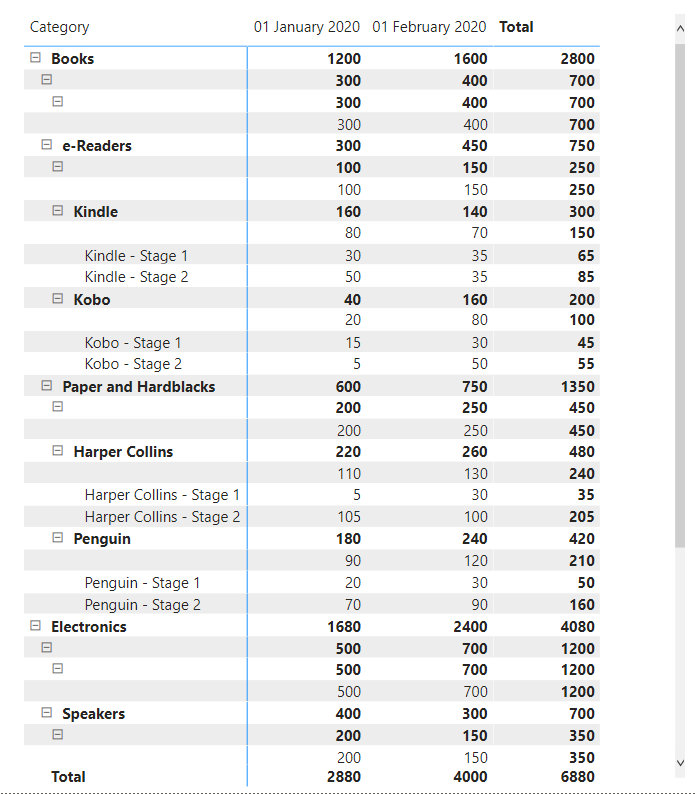
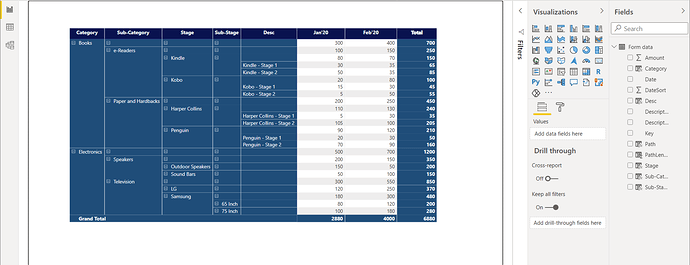
Now, just click on “Close and Apply” option, load the tables into the Power BI and create a relationships between them. Once this is done, just drag and drop the fields from the “Dimension” table into the Table visualization and the one simple basic measure that I had created. This is how the result will look like at the first instance below is the screenshot of the result provided for the reference -
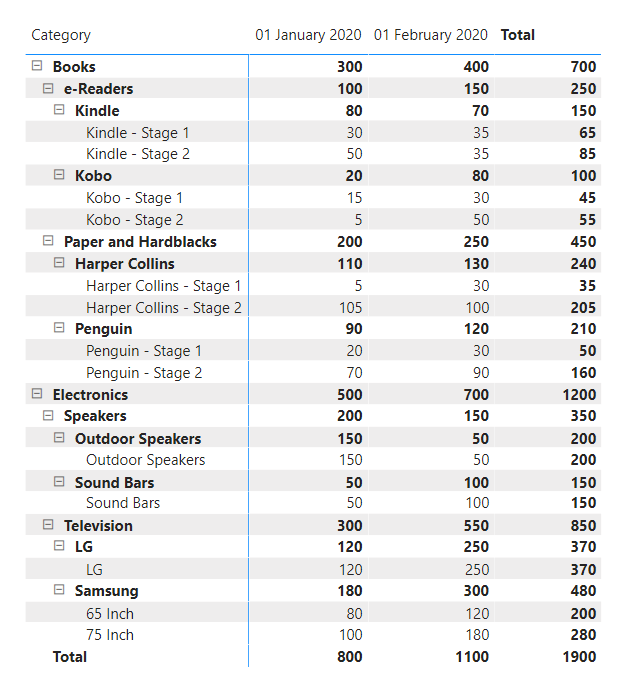
Since it includes the blanks as well. In order to remove them just go to the “FILTER PANE” and un-check the “(BLANK)” option. Below is the screenshot of the results provided for the reference -
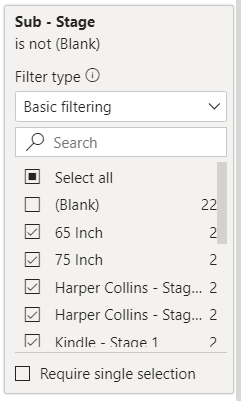
And voila!!!. This is how the results were achieved.
Note: It absolutely doesn’t matter whether you’ve 4 hierarchy levels or 10 hierarchy levels the logic will remain absolutely same in order to derive the results.
Hoping you find this explanation useful and meets your requirements that you’ve been looking for. 
And Best of Luck with the analysis that you’re trying to achieve. 
Happy Weekends!!!
Thanks and Warm Regards,
Harsh
