I want to upgrade from our company’s excel files for financial budget/forecast and reporting, And I believe I might get the money for any of those tools (~300 US$ plus per year any of those).
Does anyone have those tools’ licenses at their job? Would you recommend them, or do you want to share your experience?
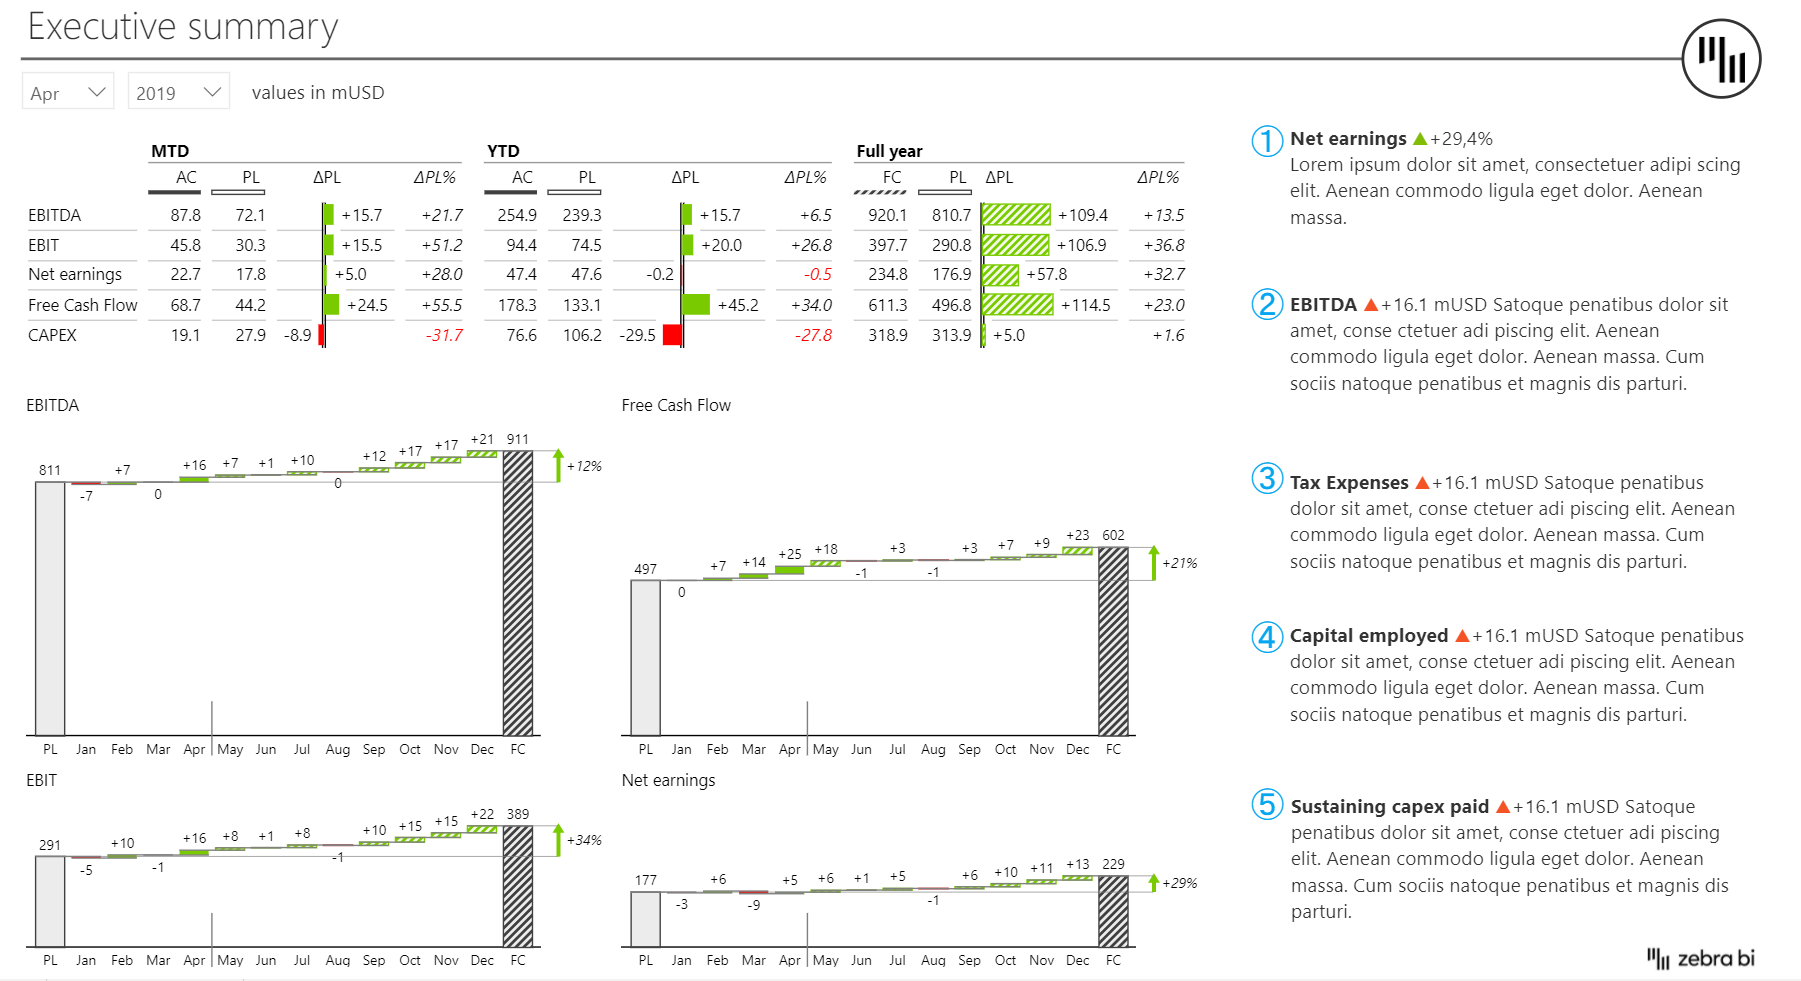
I’m interested to hear comments from others but I’ve heard a lot of praise for the Zebra BI visuals…but then I’ve only seen people post positive stuff about them on Linkedin…so not seen any negative stuff posted. So the absence of negative comments doesn’t mean there aren’t negatives.
I wonder how much of the Zebra BI visuals can be recreated in Charticulator?
While I haven’t used Zebra BI visuals myself, I have seen them used and have heard interviews with the CEO and definitely put them in the top tier of companies leading the development of Power BI custom visuals. I do use other high quality custom visuals on a fairly regular basis, and recently in response to a similar post, put together my (lengthy) thoughts on the use of top-tier custom visuals like Zebra BI. While not an entirely specific answer to your question, I hope the summary below is helpful to you in making your decision.
• Brian
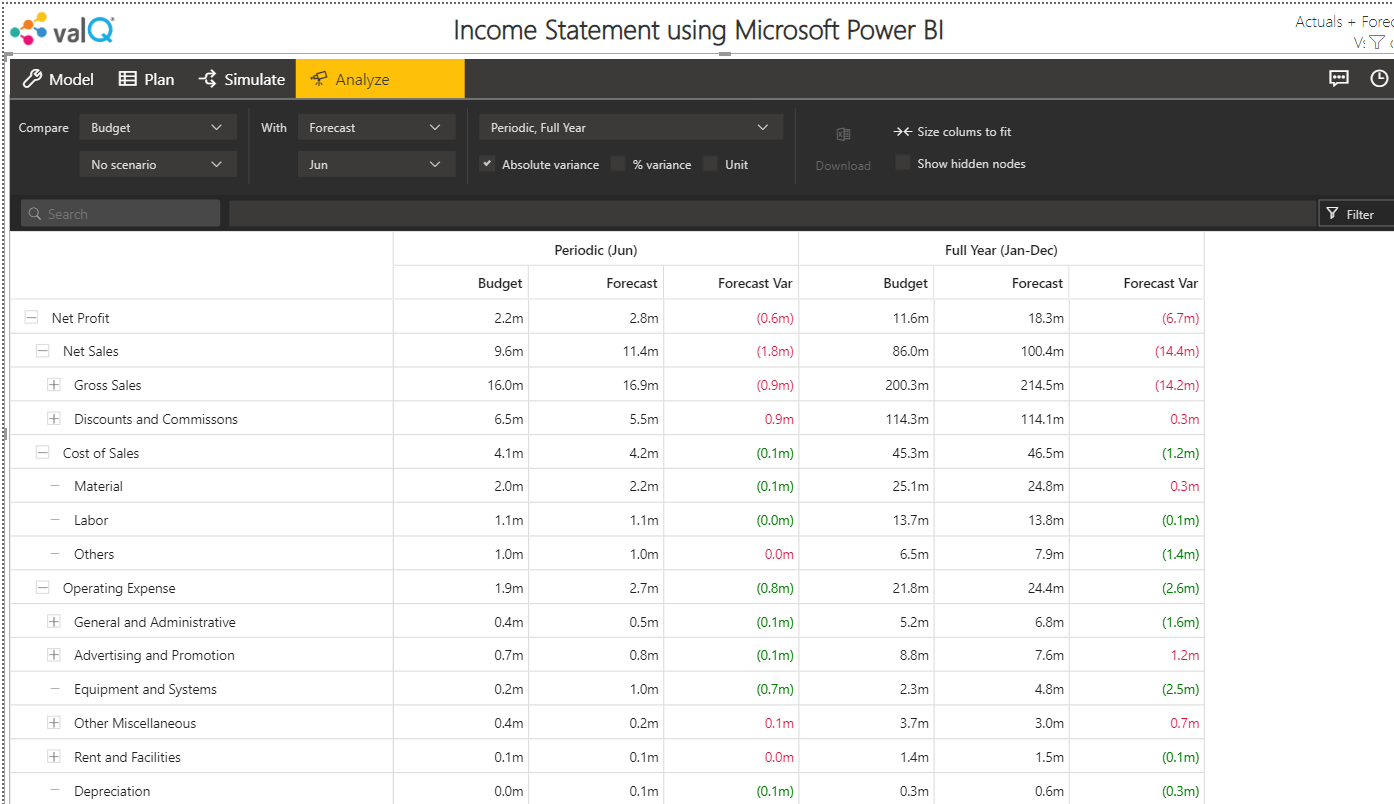
P.S. I have absolutely no experience with ValQ, so can’t comment on them either way.
Hi @jtremaria, did the response provided by the users and experts help you solve your query? If not, how far did you get and what kind of help you need further? If yes, kindly mark as solution the answer that solved your query. Thanks!
Hi @jtremaria, we’ve noticed that no response has been received from you since the 26th of June. We just want to check if you still need further help with this post? In case there won’t be any activity on it in the next few days, we’ll be tagging this post as Solved.
Hi @jtremaria, due to inactivity, a response on this post has been tagged as “Solution”. If you have a follow question or concern related to this topic, please remove the Solution tag first by clicking the three dots beside Reply and then untick the check box.
I want to revisit your earlier question. When you first asked it this summer, I didn’t have specific experience with the Zebra BI visuals. However, I made learning them one of the goals of my entry in Data Challenge #16, and I can report back that they are fantastic and I think definitely worth the money if you are regularly creating tables and visuals in your reports dealing with financial data.
They are not cheap, but I think the proper way to look at is in terms of additional capabilities and speed/efficiency of visual creation. They let you very quickly and easily compare current to previous values, actual data to forecasted values, and other common budget/financial comparisons. They also let you quickly switch between chart types and between charts and tables. The Zebra BI Table visual provides a lot more options than the native matrix, and after a brief learning curve I find them quite easy to use. If they can save you significant time in easily creating quality visuals that you would otherwise need to spend a lot of time doing in Charticulator, Deneb, R, Python, etc. they may pay for themselves pretty quickly.
They offer a full 30 day trial period where you have full access to all visual features without having to enter a credit card. It’s definitely worth taking the time to give them a thorough test run to see if they fit your needs.
Here’s the link to my Data Challenge #16 Entry, where I use The Zebra BI Visuals extensively: