Hello guys
About this video above, in Income Statements section and lecture Overlay main DAX formula combination to template design . My point is to do that big measure. Let me tell you how’s my data model:
I have the fact table called Data with : date, Acc grp2, account and value.
I have a lookup table (called Rubricas) with accGRP, AccSRT (kinda like index), AccName and Join. This last 2 are accounts names.
I have merged one to another through AccGrp and Acc grp2, and add the join field to the fact table. Maybe i didn’t have to…but the purpose is to make some sense on those accountData.xlsx (105.9 KB) Rubricas.xlsx (24.1 KB) names.
I have a measure, T Value that sums all values.
There’s 2 measures that sums revenues and costs filtered by accgrp (account number). For example, the measure Revenue = CALCULATE([T Valor], FILTER (‘Main Data’, ‘Main Data’[2D] in {“71”, “72”, “78”})) and there’s another measure of course for costs with different accounts number.
The purpose of all this is to do this measure:
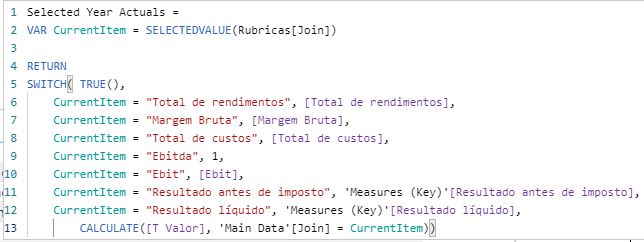
Selected Year Actuals =
VAR CurrentItem = SELECTEDVALUE(Rubricas[Join])
RETURN
SWITCH( TRUE(),
CurrentItem = “Total de rendimentos”, [Total de rendimentos],
CurrentItem = “Margem Bruta”, [Margem Bruta],
…
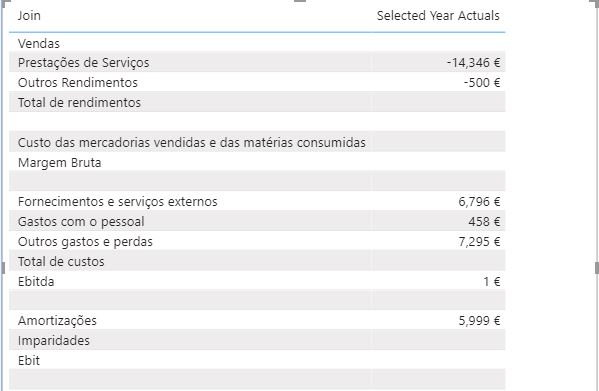
and it’s not working.
If i change above [Total de rendimentos] with a number, it shows me the number. It does not show me the measure.
Can you guys help me? Please?Data.xlsx (105.9 KB) Rubricas.xlsx (24.1 KB)

