Excel Data replicating same in Power BI Visual

Hi Experts,

Need help on this I have a data from excel and I need present in the same in Power BI

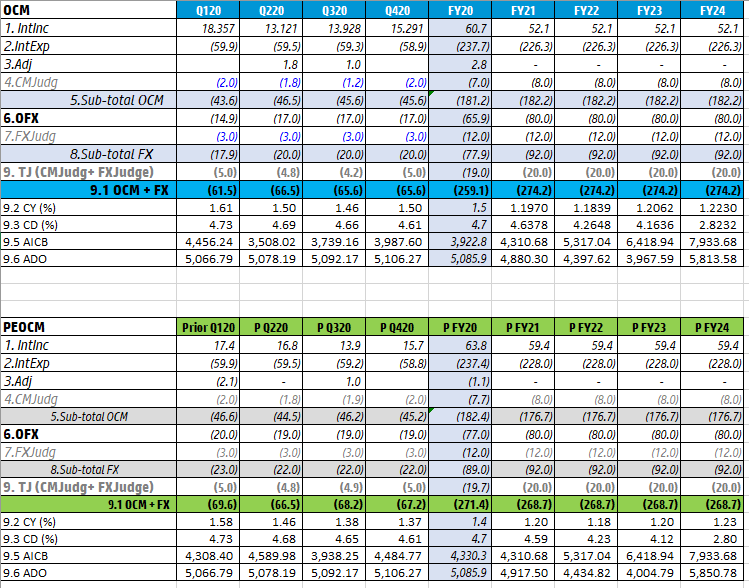
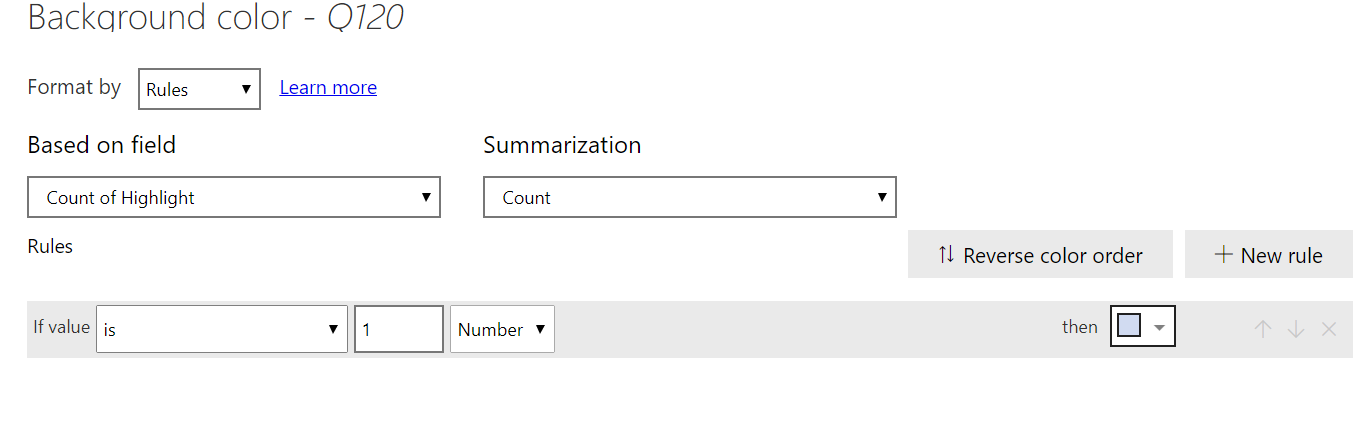
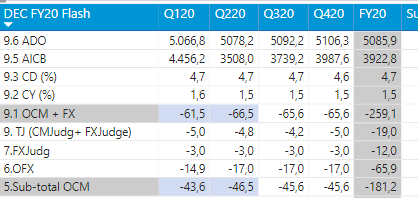
Attached is the datasheet for your reference. I need to show them in two different tables calculation remains the same except the column headers coming from different columns. Remaining calculation and sort order everything should be including the color formating for those subtotals and column (FY20 and P FY20)

Almost all the values for both tables same calculation except the column header. Is there any way we can create a DAX query which we can apply for both the tables to match.

ExceltoPowerBI.xlsx (13.4 KB)

Any help greatly appreciated.

Thanks
Putta

Hi Putta,

I’m not entirely certain what the ask is here. Are you asking how to rebuild these tables in Power BI, or am I missing something?

Correct, I was able to replicate in the table format, however the formatting of Row and Column is challenging…

Is there any way we can highlight those ROW and Columns in any visuals.

@putturps,

Here’s a technique I use to highlight specific rows in a table visual:

How to highlight Total Row - #8 by BrianJ

Highlighting columns can be done directly from the formatting options for the visual (accessible via the paint roller icon).

  • Brian

Thanks Brain, it seems for me its not working as expected.Test.pbix (456.8 KB)

Please see I am attaching my .pbix files. let me know is there any workaround for it.

Thanks
Putta

Hi @putturps,

The solution @Brian provided should work if you set up the conditional formatting based on the right rules:

You’ll get something like this:

yy

Daniel

Thank you so much experts Daniel and BrainJ… It worked for me.

Appreciate your time and help.

@putturps I am not an expert. Just a guy eager to learn from experts like Brian and others. :smile:

Daniel

2 Likes