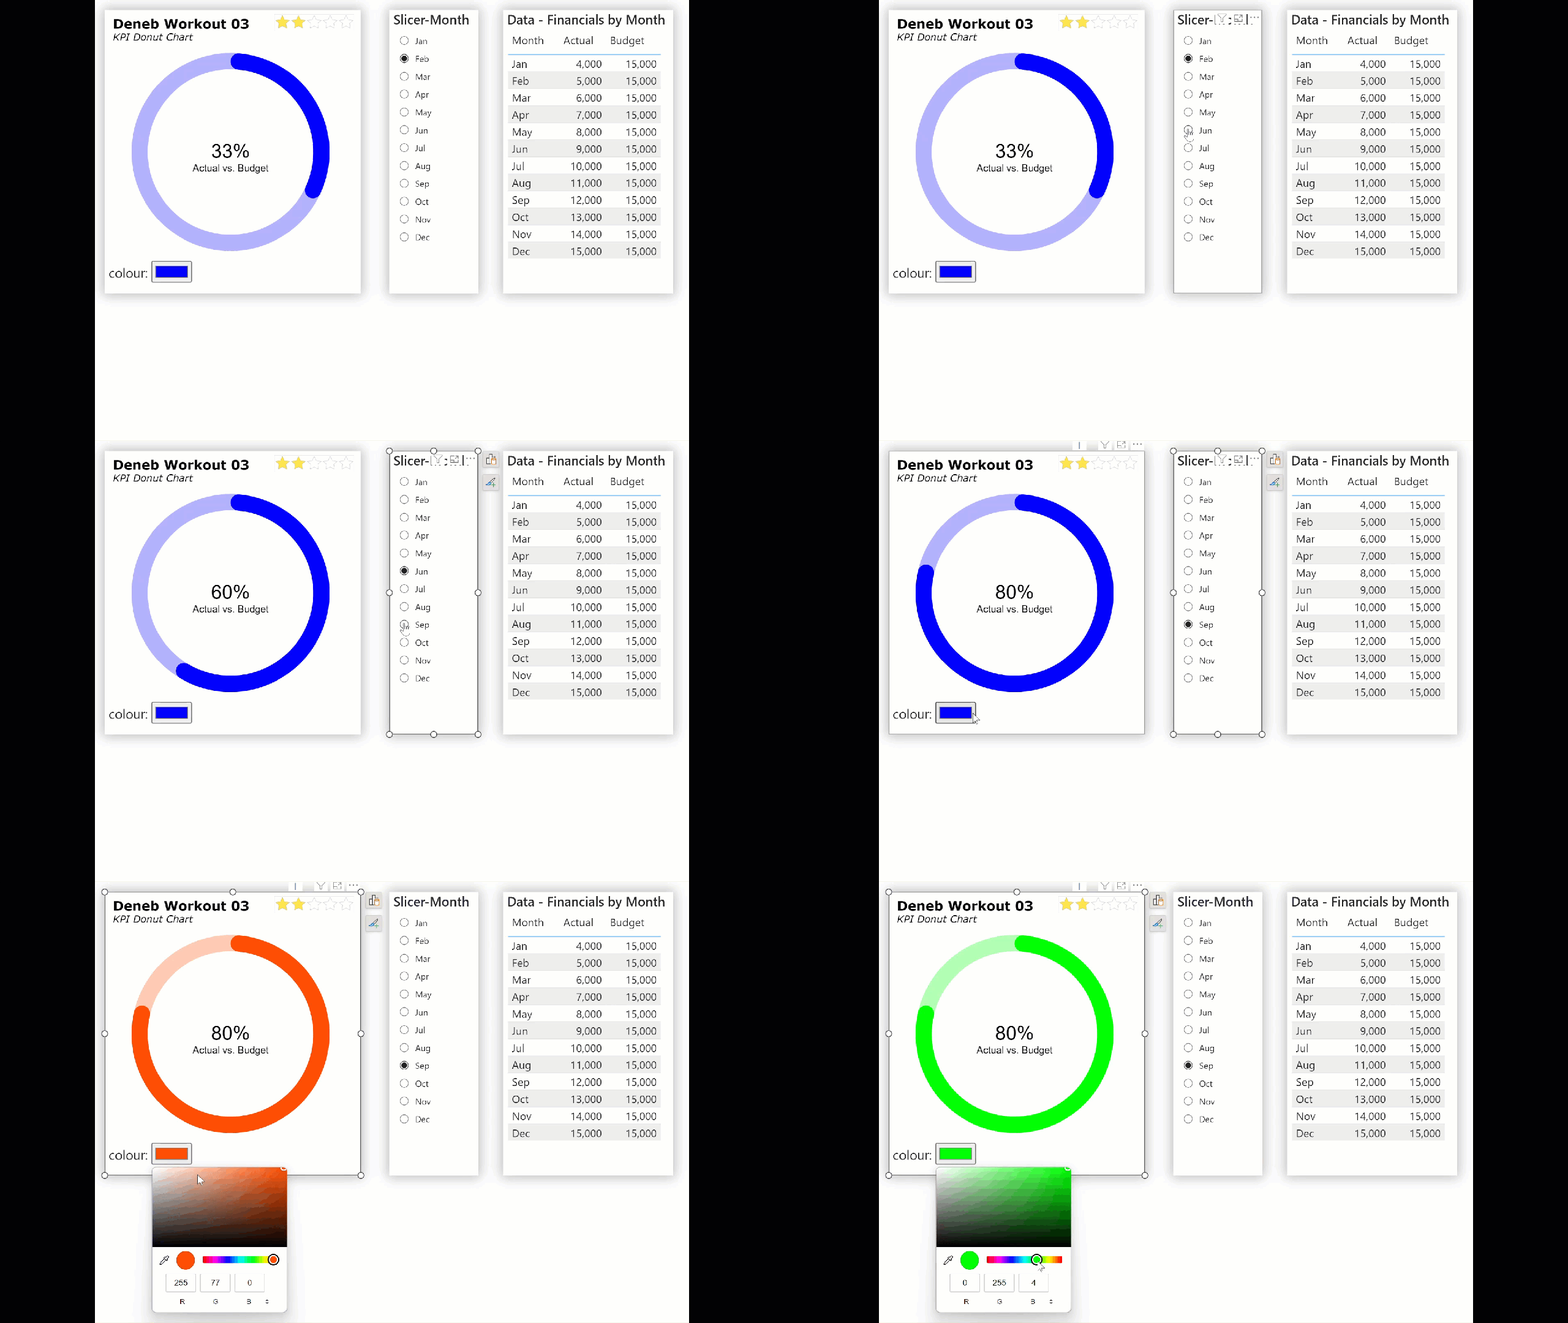
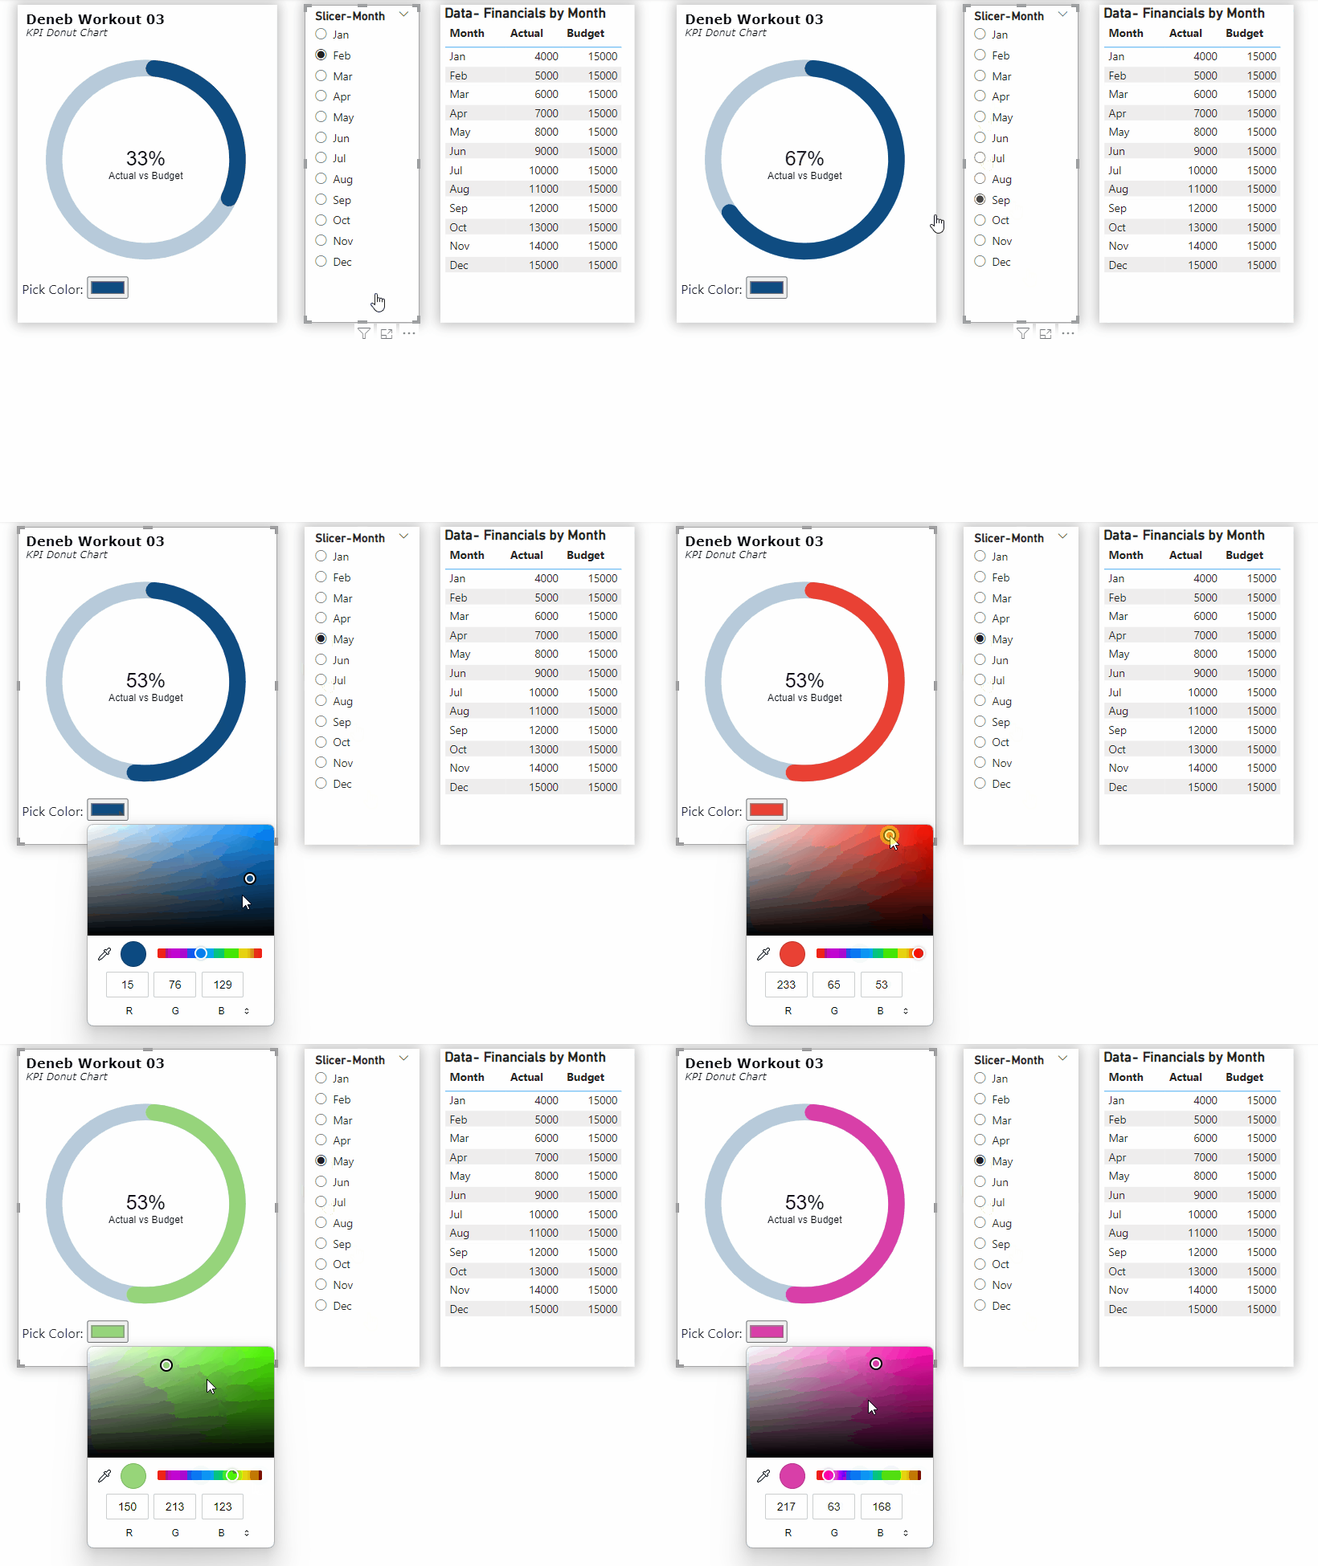
Here’s my solution to this workout, where I used several Deneb/Vega-Lite features, including:
• title block complete with subtitle
• used a transform block to extend the dataset by performing in-visual calculations to convert the percent value to radians
• used a params block to enhance the dataset with size and position settings and calculations and to house the colour: input widget
• used a layer block with 4 marks (in background-to-foreground order):
- donut background (arc mark, 100% size, colour as selected from the colour widget, opacity = 0.3
- donut foreground (arc mark, percent size, colour as selected from the colour widget, corner radius 1/2 of the donut width)
- percent value (text mark, Power BI formatting)
- percent label (text mark, Y-position lowered by 20 pixels)
Here’s the code:
{
  "title": {
    "anchor": "start",
    "align": "left",
    "offset": 10,
    "text": "Deneb Workout 03",
    "font": "Verdana",
    "fontSize": 16,
    "fontWeight": "bold",
    "fontStyle": "normal",
    "subtitle": "KPI Donut Chart",
    "subtitleFont": "Verdana",
    "subtitleFontSize": 12,
    "subtitleFontWeight": "normal",
    "subtitleFontStyle": "italic"
  },
  "data": {"name": "dataset"},
  "height": 300,
  "width": 300,
  "transform": [
    {
      "calculate": "'Actual vs. Budget'",
      "as": "_ratio_label"
    },
    {
      "calculate": "datum['Actual'] / datum['Budget']",
      "as": "_ratio_percent"
    },
    {
      "calculate": "2*PI*datum['_ratio_percent']",
      "as": "_ratio_radians"
    }
  ],
  "params": [
    {"name": "_ring_max", "value": 120},
    {
      "name": "_ring_width",
      "value": 20
    },
    {
      "name": "_ring_outer",
      "expr": "_ring_max+2"
    },
    {
      "name": "_ring_inner",
      "expr": "_ring_outer-_ring_width"
    },
    {
      "name": "_color",
      "value": "#0000FF",
      "bind": {
        "input": "color",
        "name": "colour: "
      }
    }
  ],
  "layer": [
    {
      "name": "BACKGROUND",
      "mark": {
        "type": "arc",
        "radius": {
          "expr": "_ring_outer"
        },
        "radius2": {
          "expr": "_ring_inner"
        },
        "theta": 0,
        "theta2": {"expr": "2 * PI"},
        "color": {"expr": "_color"},
        "opacity": 0.3
      }
    },
    {
      "name": "RING",
      "mark": {
        "type": "arc",
        "radius": {
          "expr": "_ring_outer"
        },
        "radius2": {
          "expr": "_ring_inner"
        },
        "theta": 0,
        "theta2": {
          "expr": "datum['_ratio_radians']"
        },
        "color": {"expr": "_color"},
        "cornerRadius": 10
      }
    },
    {
      "name": "VALUE",
      "mark": {
        "type": "text",
        "fontSize": 24,
        "color": "black"
      },
      "encoding": {
        "text": {
          "field": "_ratio_percent",
          "type": "quantitative",
          "formatType": "pbiFormat",
          "format": "#%"
        }
      }
    },
    {
      "name": "LABEL",
      "mark": {
        "type": "text",
        "align": "center",
        "fontSize": 12,
        "color": "black",
        "dy": 20
      },
      "encoding": {
        "text": {
          "field": "_ratio_label",
          "type": "nominal"
        }
      }
    }
  ]
}
Congratulations to all who participated, and good luck.
Greg
Deneb Workout 03 - KPI Donut Chart.pbix (1.4 MB)


