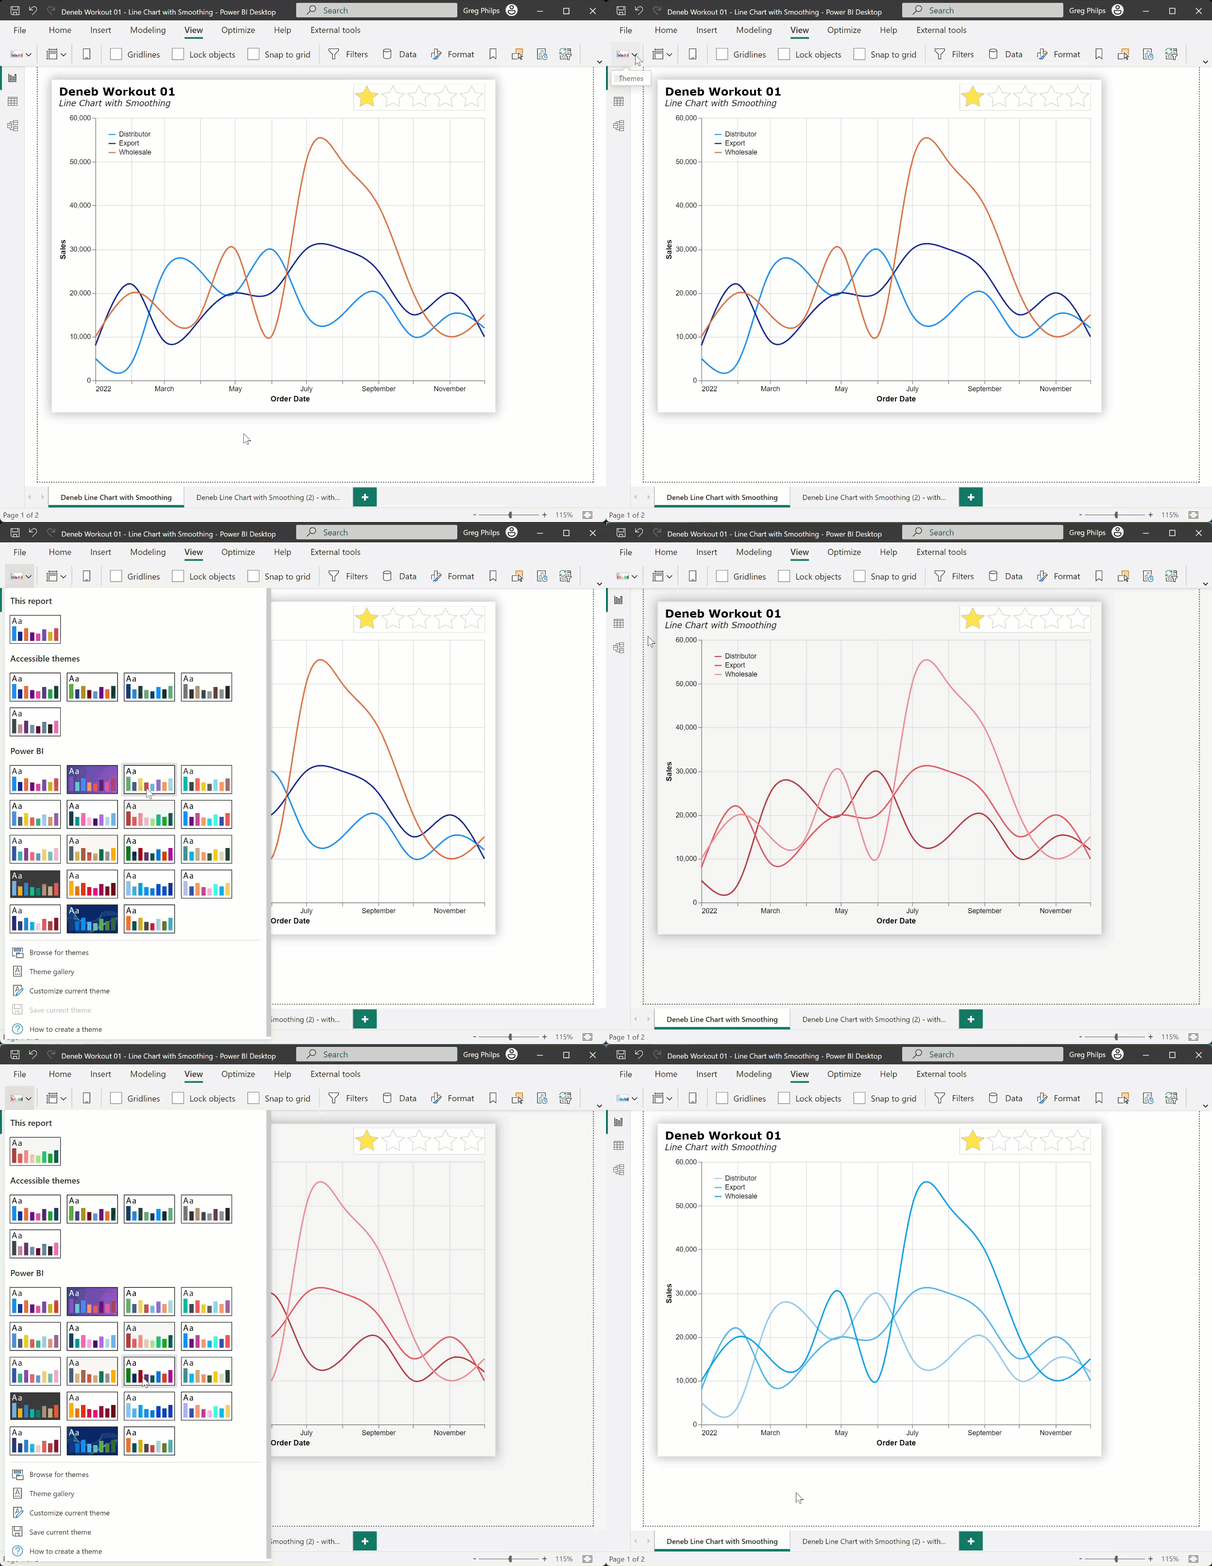
Here’s my solution to this workout:

In it, I used several Deneb/Vega-Lite features, including:
- • title block complete with subtitle
- • line smoothing (via the “interpolate” mark property) using the “natural” algorithm
- • set the range of the Y-axis to 0-60000 (via the “scale/domain” block in the Y-axis encoding
- • set the approximate number of Y-axis ticks (via the “axis/tickCount” block in the Y-axis encoding)
- • set the lines to use the current Power BI theme colours (via the “scale/scheme” block in the color encoding)
Here’s the code:
{
  "title": {
    "anchor": "start",
    "align": "left",
    "offset": 10,
    "text": "Deneb Workout 01",
    "font": "Verdana",
    "fontSize": 16,
    "fontWeight": "bold",
    "fontStyle": "normal",
    "subtitle": "Line Chart with Smoothing",
    "subtitleFont": "Verdana",
    "subtitleFontSize": 12,
    "subtitleFontWeight": "normal",
    "subtitleFontStyle": "italic"
  },
  "data": {"name": "dataset"},
  "mark": {
    "type": "line",
    "interpolate": "natural"
  },
  "encoding": {
    "x": {
      "field": "Order Date",
      "type": "temporal"
    },
    "y": {
      "field": "Sales",
      "type": "quantitative",
      "scale": {"domain": [0, 60000]},
      "axis": {"tickCount": 5}
    },
    "color": {
      "field": "Channel",
      "scale": {
        "scheme": "pbiColorNominal"
      }
    }
  }
}
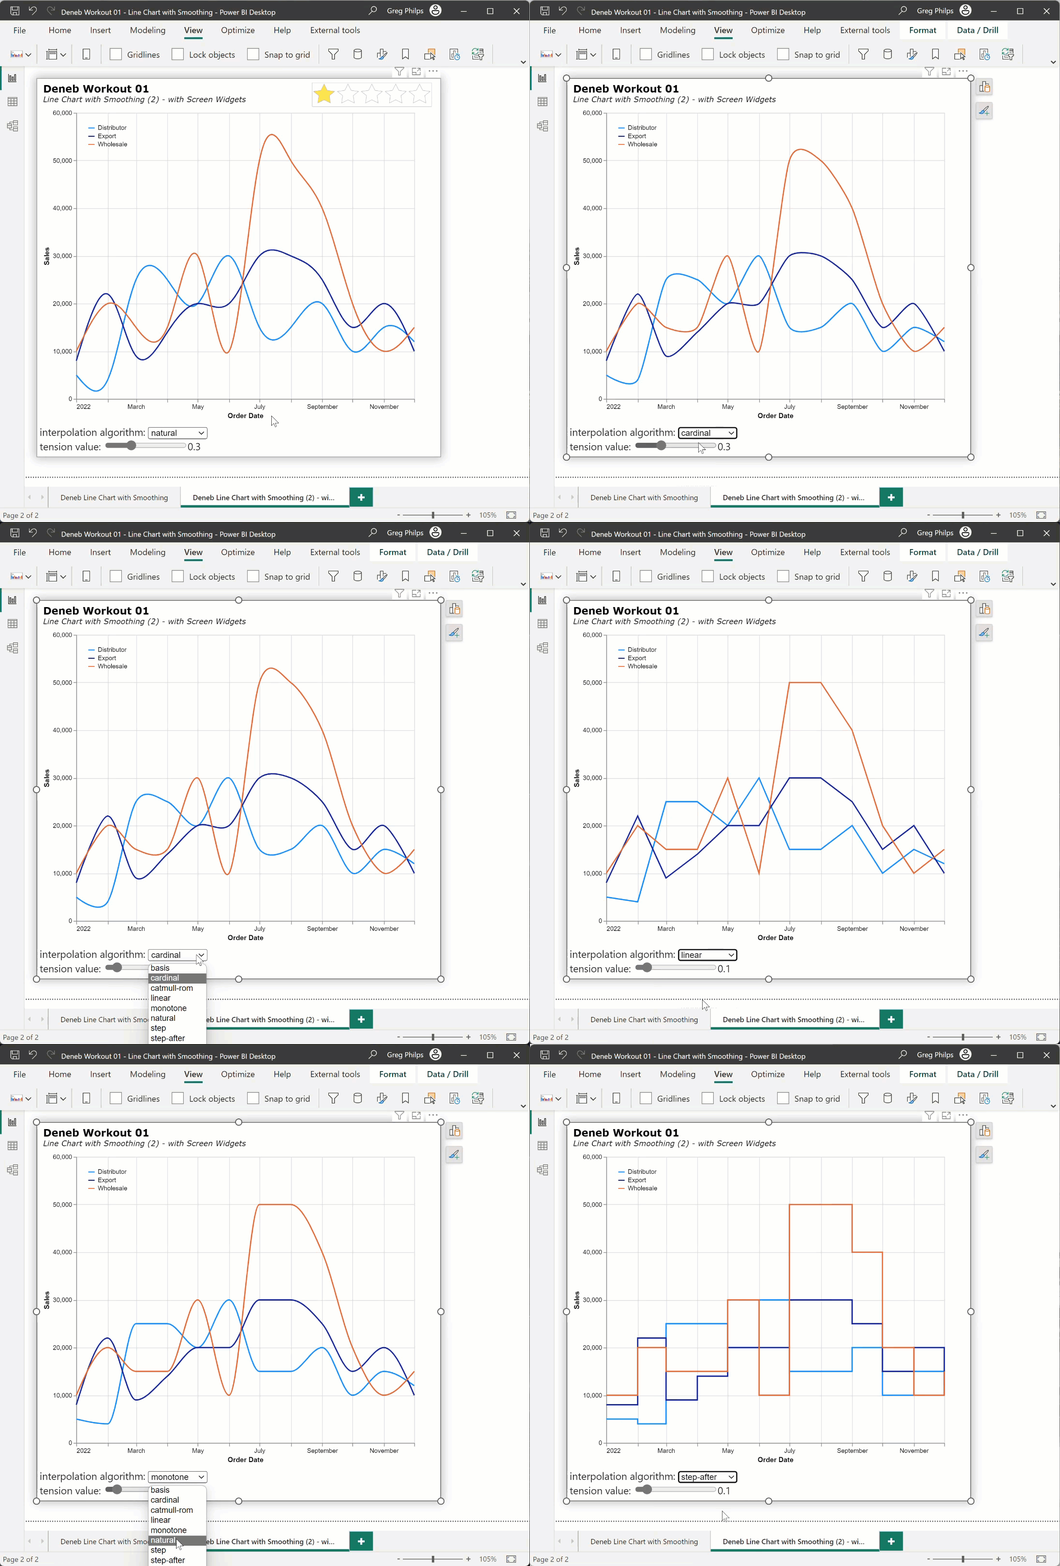
There are many line smoothing algorithms that can be used as well as “natural”, some of which also use a “tension” property. To showcase, here’s an alternate solution using screen widgets to present the “interpolate” and “tension” options:

Here’s the code for the alternate solution:
{
  "title": {
    "anchor": "start",
    "align": "left",
    "offset": 10,
    "text": "Deneb Workout 01",
    "font": "Verdana",
    "fontSize": 16,
    "fontWeight": "bold",
    "fontStyle": "normal",
    "subtitle": "Line Chart with Smoothing (2) -  with Screen Widgets",
    "subtitleFont": "Verdana",
    "subtitleFontSize": 12,
    "subtitleFontWeight": "normal",
    "subtitleFontStyle": "italic"
  },
  "data": {"name": "dataset"},
  "height": 540,
  "width": 600,
  "params": [
    {
      "name": "_interpolate",
      "value": "cardinal",
      "bind": {
        "input": "select",
        "options": [
          "basis",
          "cardinal",
          "catmull-rom",
          "linear",
          "monotone",
          "natural",
          "step",
          "step-after",
          "step-before"
        ],
        "name": "interpolation algorithm: "
      }
    },
    {
      "name": "_tension",
      "value": 0.3,
      "bind": {
        "input": "range",
        "min": 0,
        "max": 1,
        "step": 0.1,
        "name": "tension value: "
      }
    }
  ],
  "mark": {
    "type": "line",
    "interpolate": {
      "expr": "_interpolate"
    },
    "tension": {"expr": "_tension"}
  },
  "encoding": {
    "x": {
      "field": "Order Date",
      "type": "temporal"
    },
    "y": {
      "field": "Sales",
      "type": "quantitative",
      "scale": {"domain": [0, 60000]},
      "axis": {"tickCount": 5}
    },
    "color": {
      "field": "Channel",
      "scale": {
        "scheme": "pbiColorNominal"
      }
    }
  }
}
Congratulations to all who participated, and good luck.
Greg
Deneb Workout 01 - Line Chart with Smoothing.pbix (1.4 MB)