Thank you both, I’ve been searching for more than an hour. ![]()
3 Likes
Hello Everyone!
Hope you are enjoying the workouts! ![]()
Here is my submission.
Data Visulazation Workout 01.pbix (117.9 KB)
Warm Regards,
Pankaj
4 Likes
Very nicely done. Thanks for participating, and great to hear you enjoyed this workout.
There will be a new one coming every Monday, but in the meantime we’ve got a bunch of other great workouts to keep you busy until then. ![]()
- Brian
4 Likes
I did this of a combination of IF statement and ISONSCOPE function. I didn’t know the format magic trick.
Later or tomorrow I will post my solution.
2 Likes
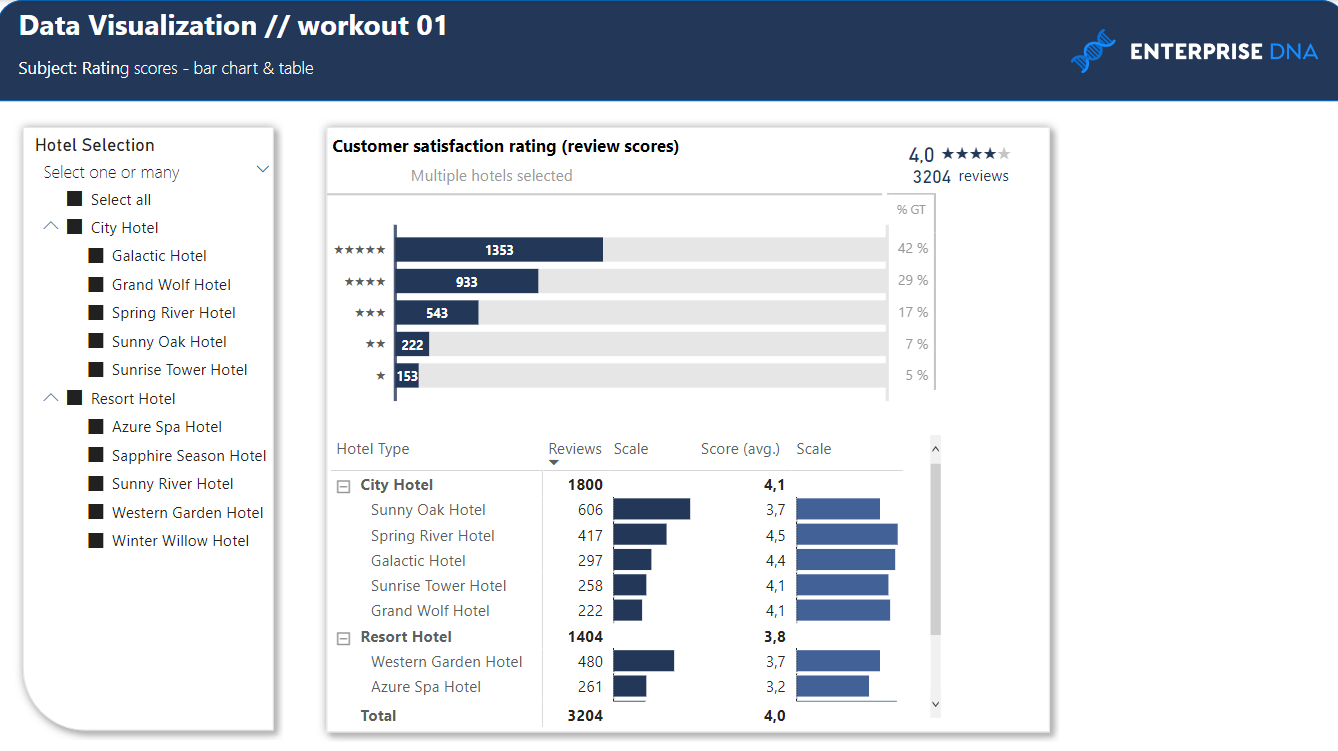
Hey All,
Thank you - This was an interesting one. Many features required a thought before implementing them.
Good Exercise.
I did try to create the Bar Chart along with %GT using Deneb, but didnt quite get there yet. - Still Practicing Vega lite.
So, Here is the screenshot of my report along with Working PBIX file. with native visuals
Workout 01.pbix (1.5 MB)
4 Likes
Hi @Gustaw. Here’s my attempt.
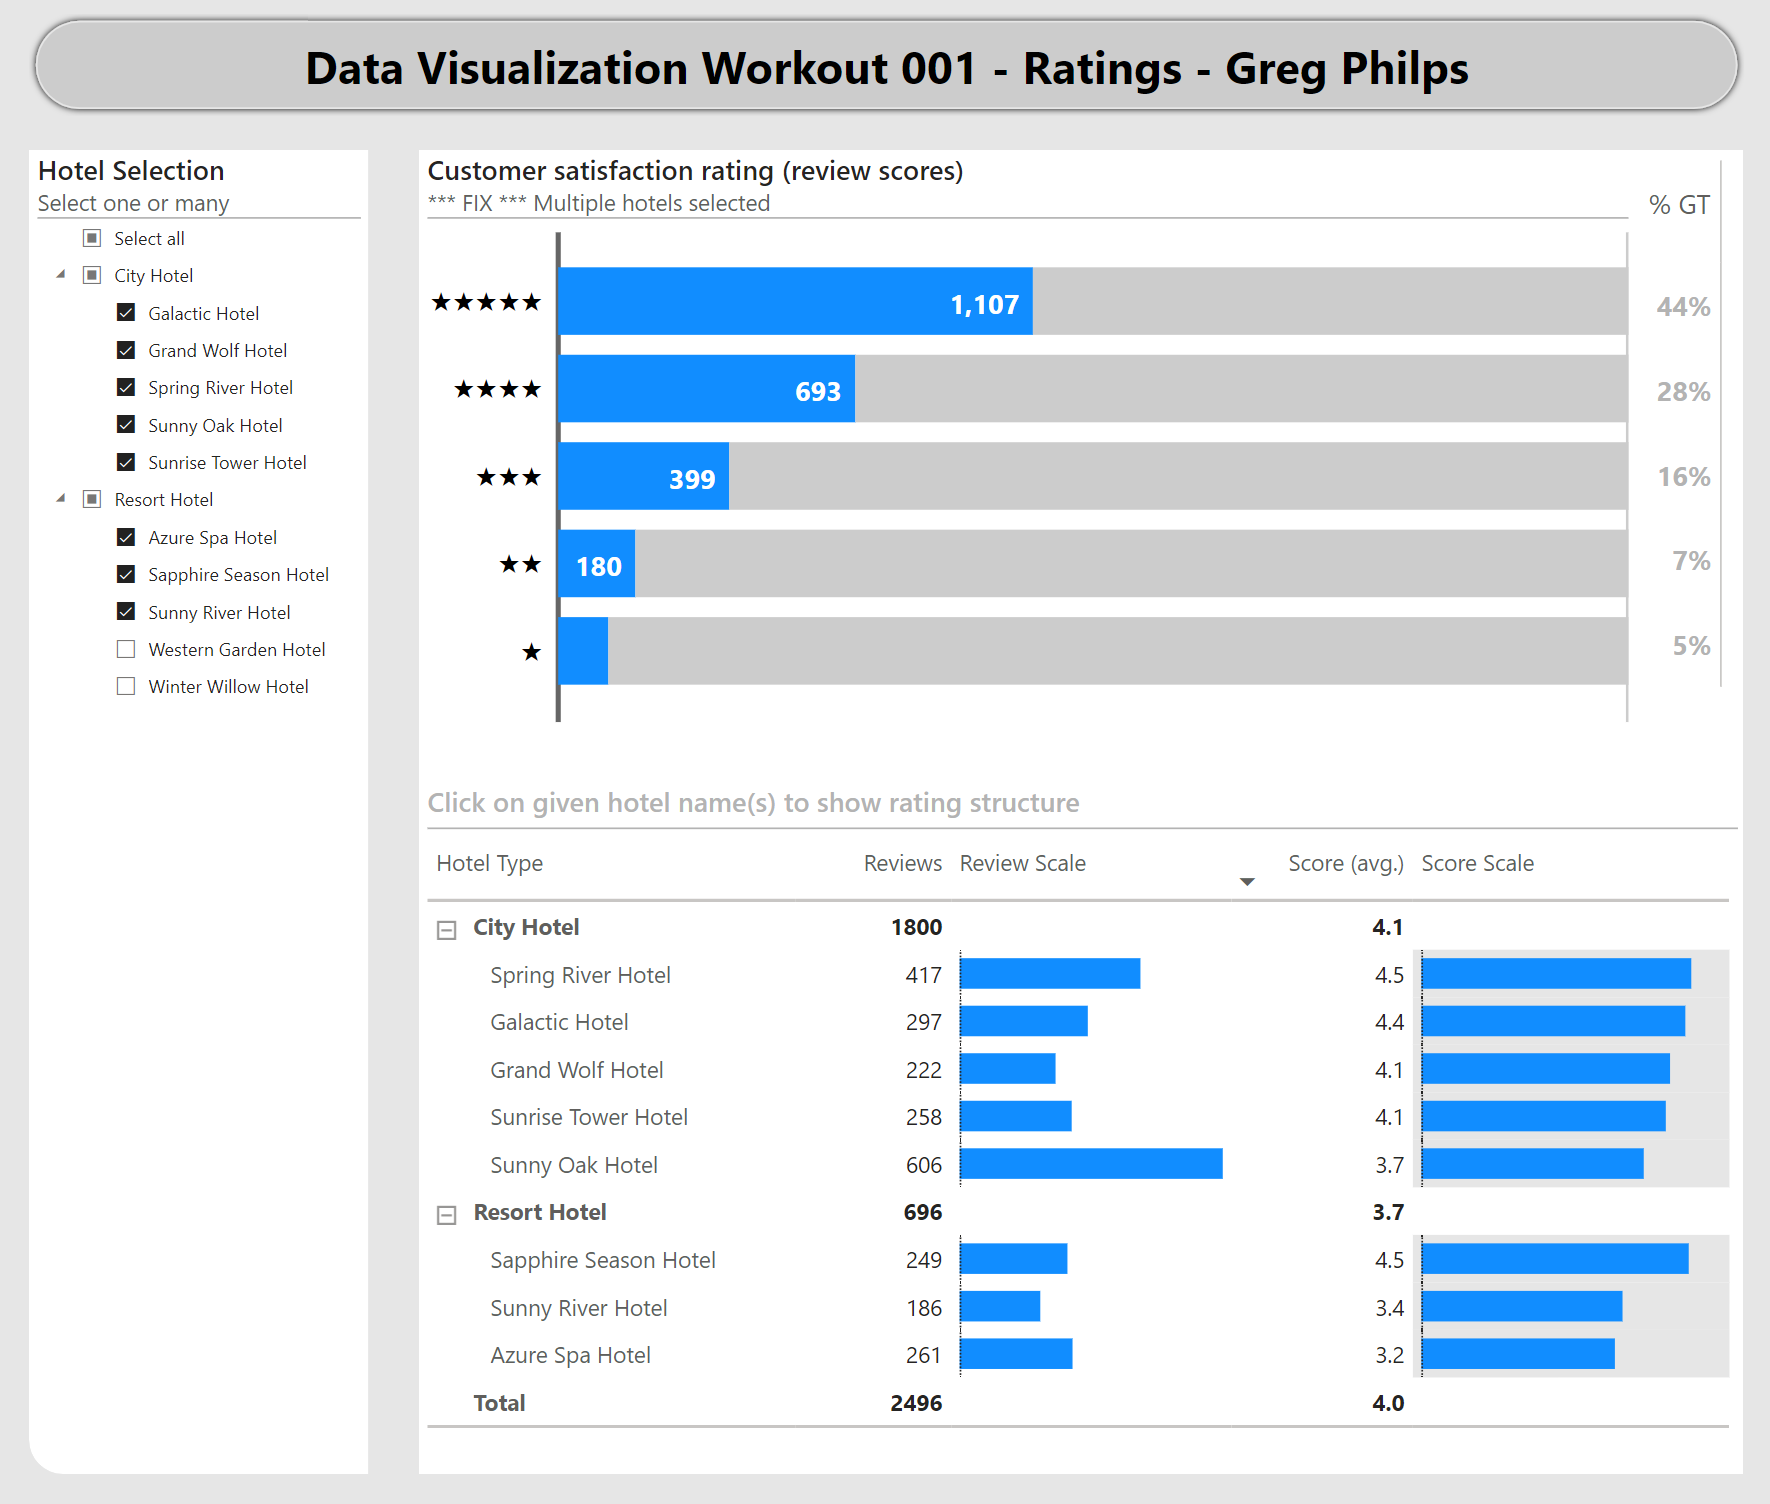
I ran out-of-time before I could investigate/implement all items (e.g., the bar chart subtitle, the “Score Scale” data bar background padding, colours, etc.).
I’ve been focussing so much on Deneb for the past year-and-a-half or so that my native Power BI visual formatting skills are rusty.
Thanks for the workout.
Greg
DV Workout 001 - Ratings - Greg Philps.pbix (35.1 KB)
7 Likes
In this workout a learnt a lot of new things like three different ways to do a star rating, using one new function in power query to repeat a code of unichar code, using concatenex, etc.
With this power query code and another trick I saw in a video I even solved a problem at my work that had been unsolved for a few days.
For me it was a really enjoyable workout and I am looking forward to the next one.
Here my solution,
Pbix
Workout 001_AA.pbix (500.8 KB)
4 Likes
Transparent Value/Color =
var Transparent= “#00000000”
return
Transparent
I use This measure and assigned it into Format cell elements Font color through conditional formatting
4 Likes
Thanks, I will also try this alternative.
1 Like
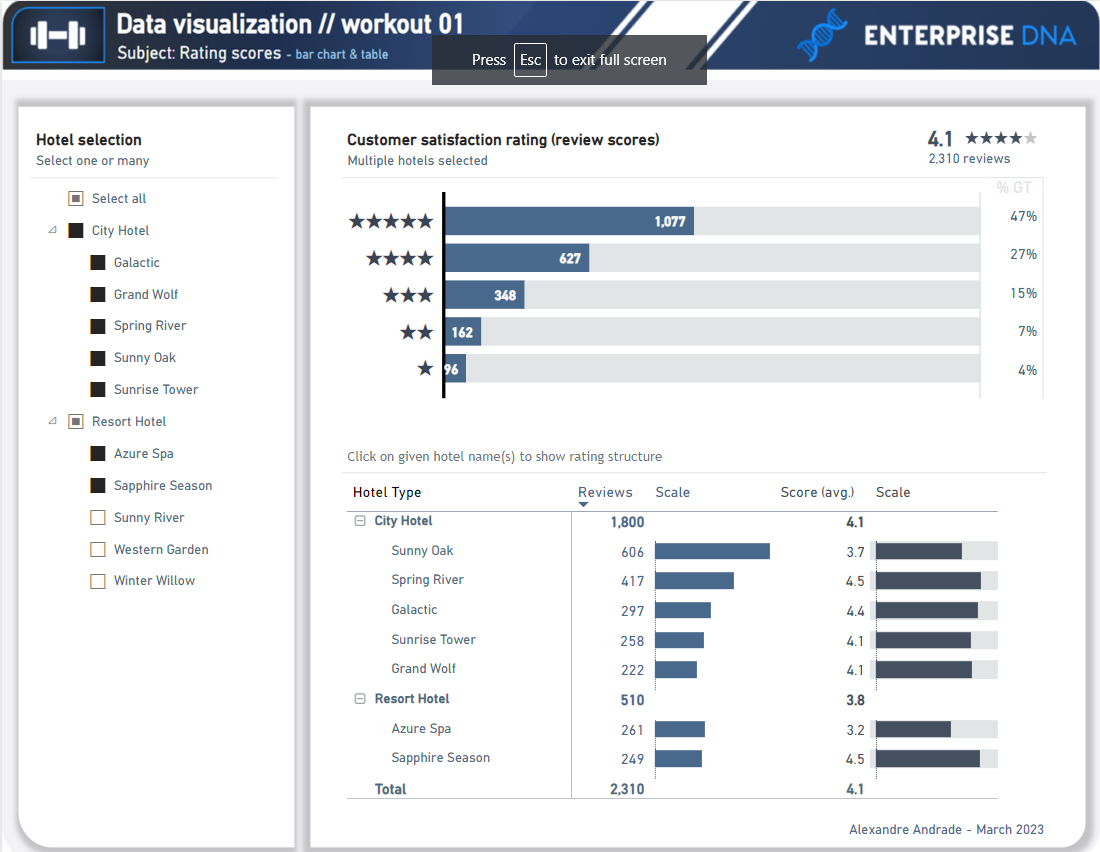
Hi @Gustaw ,
This is my contribution.
I thank you for this workout and I look forward to the next one.
01- Workout - Hotel rating (bar chart & table).pdf (160.3 KB)
01- Workout - Hotel rating (bar chart & table).pbix (105.7 KB)
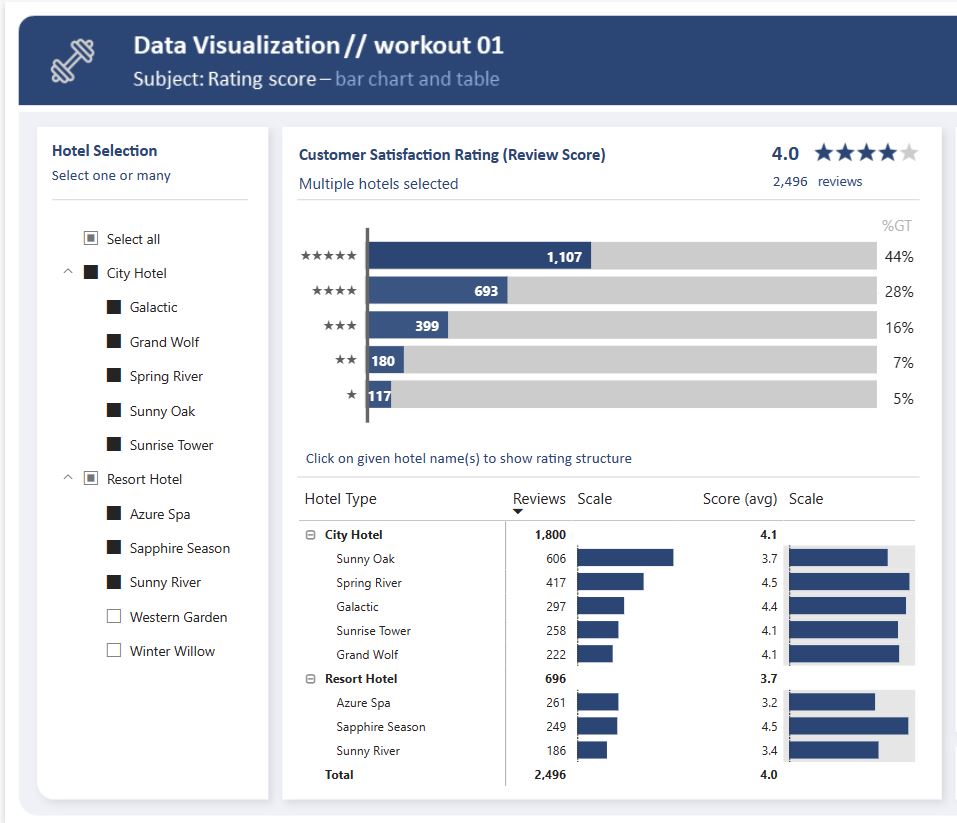
My attempt below.
PBI File:
Data Visualization_workout001.pbix (94.1 KB)
Thank you @Gustaw for the workout ![]()
1 Like
Hi everyone!
Great stuff posted so far and besides working on this challenge I’ve also enjoyed checking the entries. Well done everyone and thank you @Gustaw for posting this workout, I really enjoyed it.
Except for the star custom visual, I used PBI native visuals because based on my experience, most of the clients prefer NOT to take the risk of using custom visuals, but I tried to make it looks like yours as much as I can.
I downloaded Star custom visual from Pragmatic Works website. Using below link you can access all the custom visuals on their sharepoint folder:
https://pragmaticworksonline.sharepoint.com/:f:/s/FileShare/Ejn3BZIKy-NHk0DHsQUqT5QBx8WaO5HCyu0Qo7pWOzaWmw?e=hfCtIf
This is my submission:
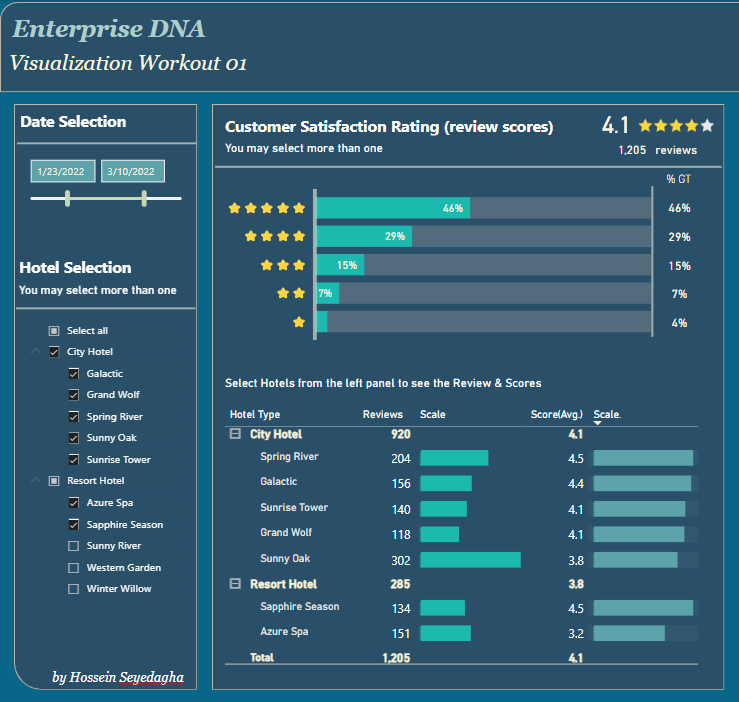
Here you can find PBIX file:
Viz Workout No1 Hossein.pbix (327.5 KB)
Thanks & Regards,
Hossein
6 Likes
Fantastic workout. Submissions are incredible. Well done everyone
8 Likes
Great entry! You actually broke the ice, as your submission was the 1st one withing this workout session! I really like how you replicate several details (like grey bars on a bar chart // blue & dark font within the table and a few others!
Amazing job! Thank you for your participation!
2 Likes
Hello @DavieJoe
Great to see you participating in this workout installment!
Amazing entry, I like everything here - it’s clean and well-aligned!
I like also a few small detailes, such as light-grey background below the databars!
Great work! Thanks for participation!
1 Like
Hello @DianaAckermann
Great entry! I like your creativity - shown by adding a few additional elements, that bring value to the report. You also placed the overall ratings on the left, so it’s visible at the first glance what the “big numbers” are.
Amazing work! Thank you for participation!
2 Likes
Hello @mspanic
Super entry!
Clean and concise visualization.
I really like how you managed the overall star-rating visualization with use of a native table!
Thank you for participation!
1 Like
Hi @tweinzapfel
Great to see your entry!
I really like your replica - it’s kept in a simle & clean fashion.
Amazing job!
Thanks for participation!
1 Like
Hi @Dharma
This is amazing report makeover.
It’s great to see how you creatively replicate the set of visualization using dark-theme.
Also, I really like the right section with a brief workout summary - it looks fantastic!
Great work!
Thank you for participation
1 Like