Sample_File.pbix (123.5 KB)
Objective_1_FACT.xlsx (10.8 KB)
Objective_2_FACT.xlsx (10.9 KB)
Objective_3_FACT.xlsx (10.9 KB)
Assessor_DIM.xlsx (8.5 KB)
Employee_DIM.xlsx (8.5 KB)
Dear Experts,
Good Day!
I have attached the sample excel data where my staff is being assessed on 03 different objectives.
The data pertaining to assessment is in below three excel files which contains duplicates and same staff will be assessed more than 01 time. All file structured remains the same but OBJ1_KPI1 column heading/name will be changed in each file. (i have replaced the original data with dummy data)
- Objective_1_FACT
2.Objective_2_FACT
3.Objective_3_FACT
In addition i have made to DIM table that contains my employee information and assessor information.
The excel files are below without duplicates.
1.Assessor_DIM
2.Employee_DIM
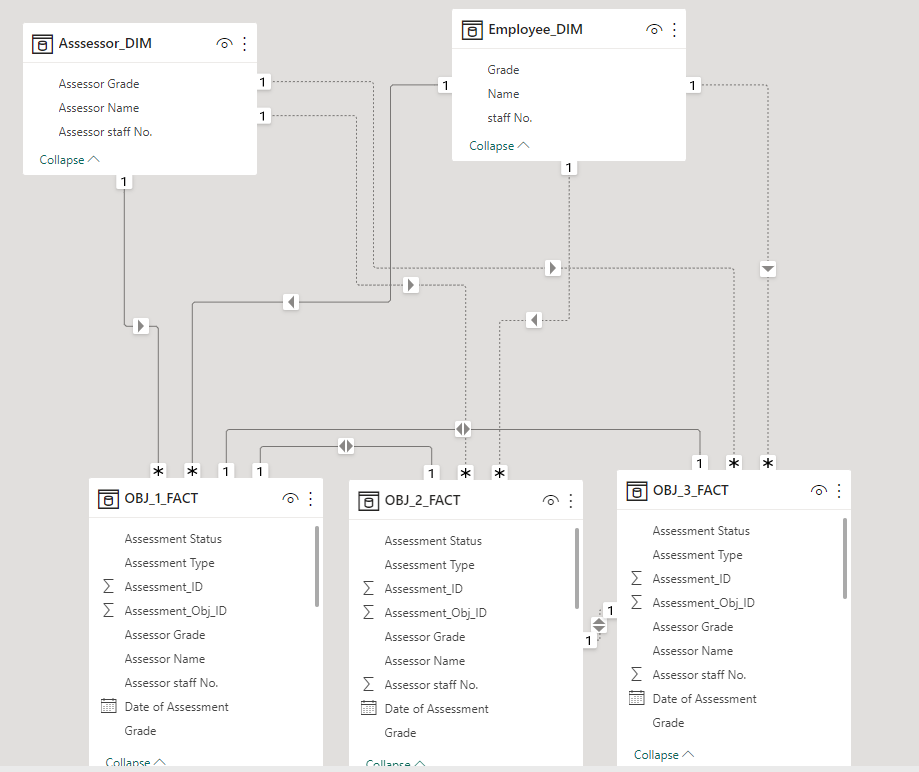
Now when i made the data model(Picture attached) i gives very confusing image and i am not able to identify which Schema it followed or what is the best practice to make data model for this data set.
My objective is to create a dashboard where i can check the ratings provided my assessors , its trend, distribution and other KPI’s.
Assessment Ratings are as Follows:.
1.COM - Competent
2. DEV - Development
3.EE - Exceed Expectation
4. SEE - Significant Exceed Expectation
I need help and guidance how can i make the data model for this data set that works effectively and i am able to achieve the objective of my dashboard.
Please feel free to ask any question.
Thank you
I would say after looking at the data model diagram, there are some bi directional 1:1 relationships between Fact tables, I would be very cautious about those, and would suggest to remove them, as it could potentially cause ambiguous results as one fact table could filter another making it hard to find errors.
If all the fact tables are the same, then could you not append them, if you need to filter by objective, you could introduce an objective DIM table, this would simplify the model leaving you with 3 dimensions and one fact table, which should help simplify your calculations.
Hi @kylie.oconnell
Thank you for your reply and let me explain further.
Indeed the FACT tables are the same from S.No to Assessment_Obj_ID (Columns Only).
Afterwards each FACT tables changes in terms of Objective score.
For example:
Objective_1_FACT excel file will have score related only to Objective 1.
Objective_2_FACT excel file will have score related only to Objective 2.
Objective_3_FACT excel file will have score related only to Objective 3.
Also the name of Objective 1_KPI1 and others objective_KPI names will be different in each file.
I that case how to make a model, Please guide.
Thank you.
Sample_File.pbix (123.0 KB)
You don’t need to make relationship between the fact tables. Make the relationship between the dim and fact table. Please find the pbix file for your reference.
Regards,
Different people will model things differently, so what I say is not necessarily the best, so take what everyone says and try it for your self and come up with what’s best for you.
I would still append all the tables, and add a column for objective, that way it doesn’t matter if all the scores are different for different objectives because you can identify each objective.
I would do the same for each item that separates the objective, and add a dimension table for it. This should allow you to slice and dice by the dimensions of the objective.
This will mean your measures may have to contain specific filter context for specific columns to separate out the desired records. That said if you imagine a matrix with score in rows and objective in the column, due to the structure of the table it would sum up accordingly, in separate tables you need a measure per table.
That would be the main difference you would need measures for each table for each calculation.
Think of it as sales on a supermarket each category product would t be in a separate table, they are all facts about sales the attributes about the product is in a dimension table. Your fact table contains information about objectives.
But take something from what everyone says and adapt your model with what works best.
Thank you everyone for your prompt help and guidance.
I will make the model based on the above discussion and inform which one works fine based on my requirement.
Thank you.
Hello @EnanBahadur
Did the responses above help solve your query?
If not, can you let us know where you’re stuck and what additional assistance you need?
If it did, please mark the answer as the SOLUTION by clicking the three dots beside Reply and then tick the check box beside SOLUTION
Thank you
Hi @EnanBahadur
We’ve noticed that no response was received from you on the post above.
Just following up if you still require assistance to solve your inquiry.
In case there won’t be any activity on it in the next few days, we’ll be tagging this post as Solved.
Dear @kylie.oconnell
Thank you for for your guidance, i build the model based on your advise and its working fine till 
I have put the logical slicers as well and its working.
Thank you.
1 Like