Hi,
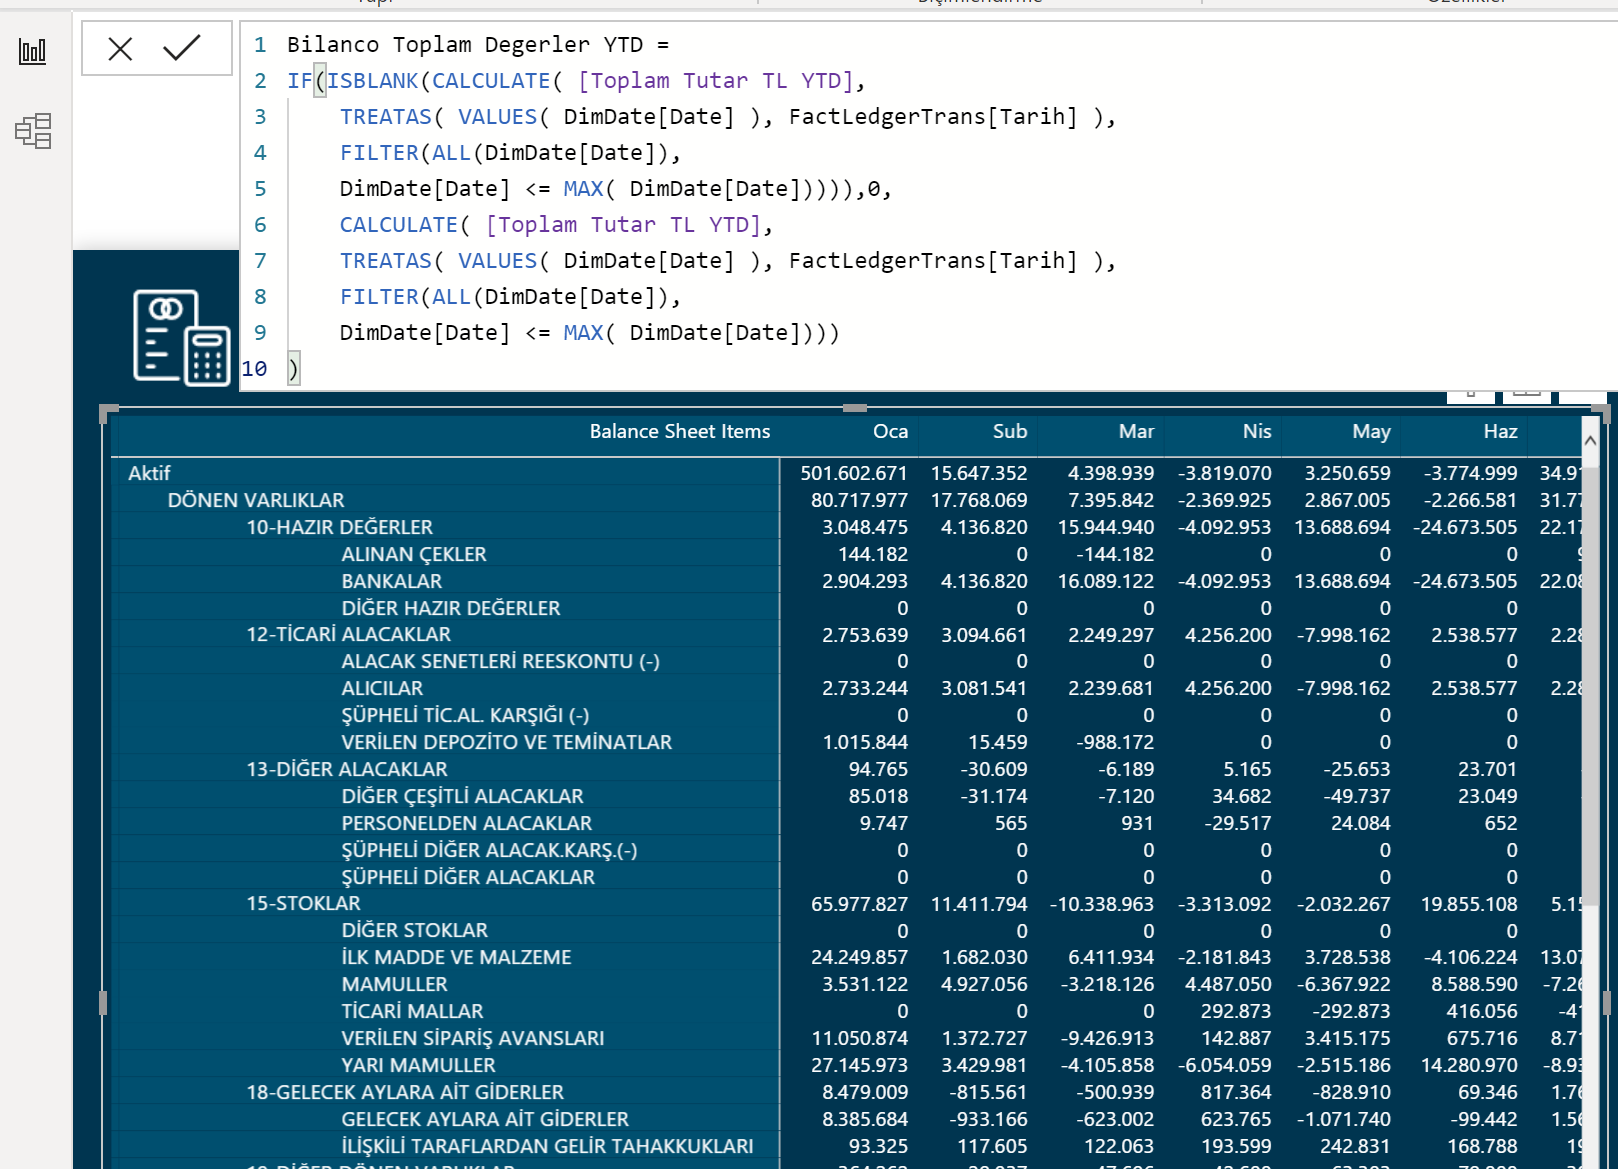
I am trying to get the cumulative totals in a maxtix visual seen below:
I have tryied DATEYTD as well but it is not showing the correct numbers. Once I dragged monhts onto the columns it is automaticaly filtering the month and showing the months results indivudally.
In the financial reporting w/ power bi module, I have done everything perfectly. I applied all the techiques. It is 100% working. However once I calculate the cumulative totals it is not working.
Is there any way to do this cumulative totals in a income statement?
@M_ocelik,
Please post a sample PBIX file so that we can better assist. Too hard to tell what is going on without seeing your data model.
Please review this link regarding asking questions on the forum:
https://forum.enterprisedna.co/t/does-your-support-question-have-everything-required-to-be-answered-effectively/3953
Thanks
Jarrett
Hi @M_ocelik
I will recommend you watch this course for better data modeling which can give you edge in this current work and the future encounters
DAVID
Hey
Thanks for reaching out on this. Can you post a copy (or cutdown copy) of the PBIX file?
Hi all,
Thanks a lot for your answer. I am sorry for inconvenience regarding the forum rules. Next time I will be careful.
First of all I watched Financial reporting module. So that’s why I was able to model income statement and the balance sheet successfully. It is woking fine. It’s a great course.
Because it is live connection to the SSAS, therefore I can not copy my original file. However, I made exact same copy with Sam’s file that he covers during the module. In this file all I did was to modify the Selected year actuals measure for YTD and then the corresponding measures accordingly. I modified Revenues, COGS, profits etc. all the related referenced measures in the selected year actuals meausure.
All I am trying is in a matrix table I want to be able see the income statement items on the rows and months on the columns. And I want to be able to see results cumulatively starting from january to december.
In the demo file that I am attaching there are Two sheets. One with YTD and the other is normal one. The one with YTD is showing montthy results although I modified each measure for YTD. I guess once I put the months onto the columns it is filtering each month individually. I tried ALL, and ALLSELECTED to change context however it is not working as well.
so I appreciate for your replys.
Thanks
all the bestFinancial Reporting In Power BI - Kopya.pbix (894.1 KB)
@M_ocelik,
Do you just want a cumulative total for the selected year, or do you want a cumulative total from the beginning of your data?
Here is a measure that will get you the total from the beginning of your data:
     Cumulative Totals =
    CALCULATE (
        [Selected Year Actuals],
        FILTER ( ALLSELECTED ( Dates[Date] ), Dates[Date] <= MAX ( Dates[Date] ) )
Here is measure for just selected year:
Cumulative Totals Selected Year =
VAR LastSalesDate =
    CALCULATE (
        LASTDATE ( 'Income Statement'[Months] ),
        ALL ( 'Income Statement' )
    )
RETURN
    IF (
        SELECTEDVALUE ( Dates[Date] ) > LastSalesDate,
        BLANK (),
        CALCULATE (
            [Selected Year Actuals],
            FILTER ( ALLSELECTED ( Dates ), Dates[Date] <= MAX ( Dates[Date] ) )
        )
    )

        )
Watch these 2 videos to see how I got the measure for each of these:
Thanks
Jarrett
3 Likes
Hi @M_ocelik, a response on this post has been tagged as “Solution”. If you have a follow question or concern related to this topic, please remove the Solution tag first by clicking the three dots beside Reply and then untick the checkbox. Also, we’ve recently launched the Enterprise DNA Forum User Experience Survey, please feel free to answer it and give your insights on how we can further improve the Support forum. Thanks!
Thanks Jarret.
It’s now working. I watched the videos that you suggested. It’s a realy nice technique. I really appreciate.
1 Like