Hi All,
This time I create my report thinking in the things I wanted to learn in Power BI.
I wanted to use:
- DataFlows: in my workspace I stored the Dates DIM table that I use all the time. I am very happy because is much easier to share and maintain.
- Text with measures: I create an Analysis with a narrative for storytelling. I made many assumptions for my analysis from the data provided
- Bookmarks: I used buttons to navigate thru the bookmarks. I was enjoying creating my report until I start using the bookmarks

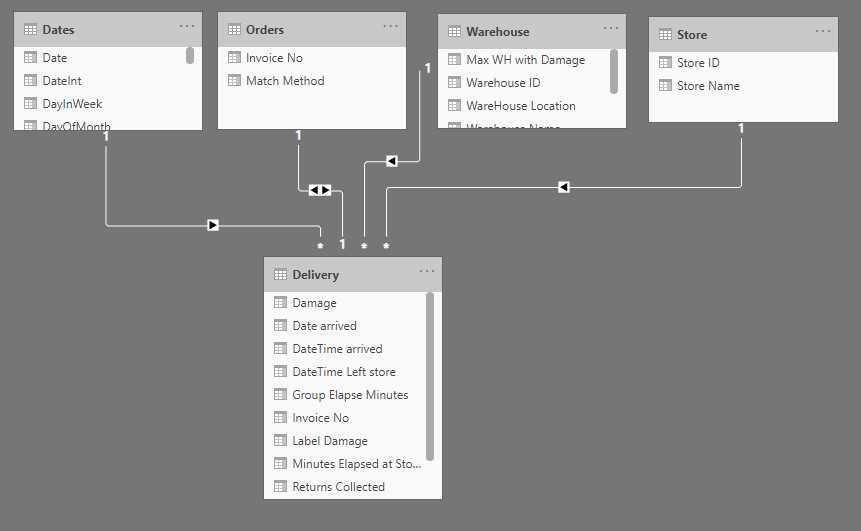
The data model
Data ModelDimension: Dates, Orders, Warehouse, and Store
Fact: Delivery. There the problem with the different date formats, I did the following:
- I changed the date to text.
- I did analysis of the problem, there were mixed mm/dd/yy with dd/mm/yy. And the Depart date had not errors, I assumed the problem was with the dates with mm > 12, so,
- I split the dates and time, then I split the dates again in mm, dd, and yyyy. To create my date I concatenate mm, day, and year using the logic “If mm > 12 then use the mm as dd and the dd as mm”,
- Then for the elapsed time between arrive and departure of an order. I create a column with using DateDiff. I got the elapsed time in minutes.
- I try to make sense of the data using my elapsed column and I decide to use the average, so I create an average measure of my elapse time.
Data Analysis
My questions are:
- How the elapsed time between arrive and departure of an order is behaving?
- How many Manual Entries/Cancelations/Label Damage/Damage we have and where and when?
- I also (to use my narrative) create a more depth analysis of the Elapse Time of the orders.
I made many assumptions for my analysis from the data provided, but I think is okay for this kind of exercise.
I am not very happy with my Analysis window, I found difficult to format the message, maybe using HTML will be better.
QUESTION!!! I could not figure out how to get the store with the highest elapsed time in a measure, I wrote the name, but I wanted to have it dynamic. If some one has a suggestion, I will appreciate your comments.
I hide the field used for creating my relationship in my Fact table.
Design
I wanted to keep everything in one page and use Bookmarks to navigate into the report. This was a hard learning experience, I do not recommended to use it when you have a report that change frequently, is a pain (at least for me it was) to create the bookmarks and connect the action of the buttons with them. I have to do it three times because when you create a bookmark keep the filters and content of the visual, so you have to be very careful everything is as you want it, and if you decide to change something you have to do it all over again. 
I created the Filled Donut using a bar chart (behind) and a donut char in front.
For the theme colors I looked for some inspiration and I got my design.
I attached the PBIX to this message.
Please let me know if you have any question or comments and suggestions to improve my report.
Thanks,
Diana
Delivery App Data - Diana Bello.pbix (605.9 KB)
