Here’s Jose’s entry for Power BI Challenge 13. @jbressan, would you like to share how you built this dashboard and what your inspiration is in building it?
Here’s the link to the report:
To learn about the real-life scenario presented for the challenge, be sure to click on the image below.
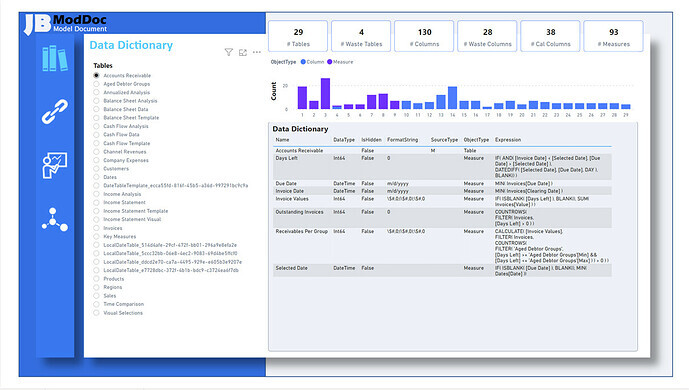
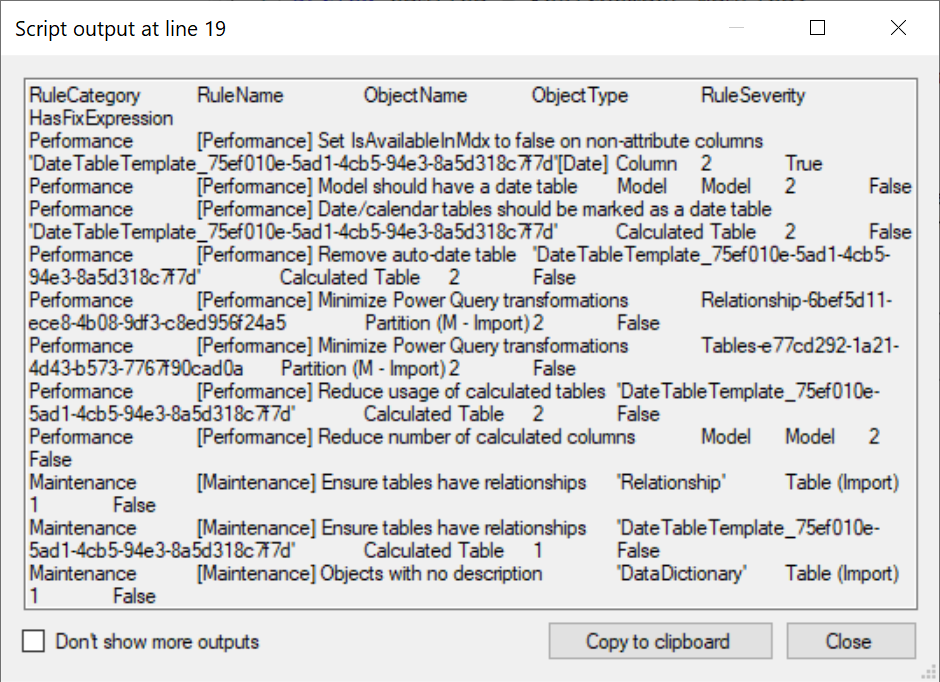
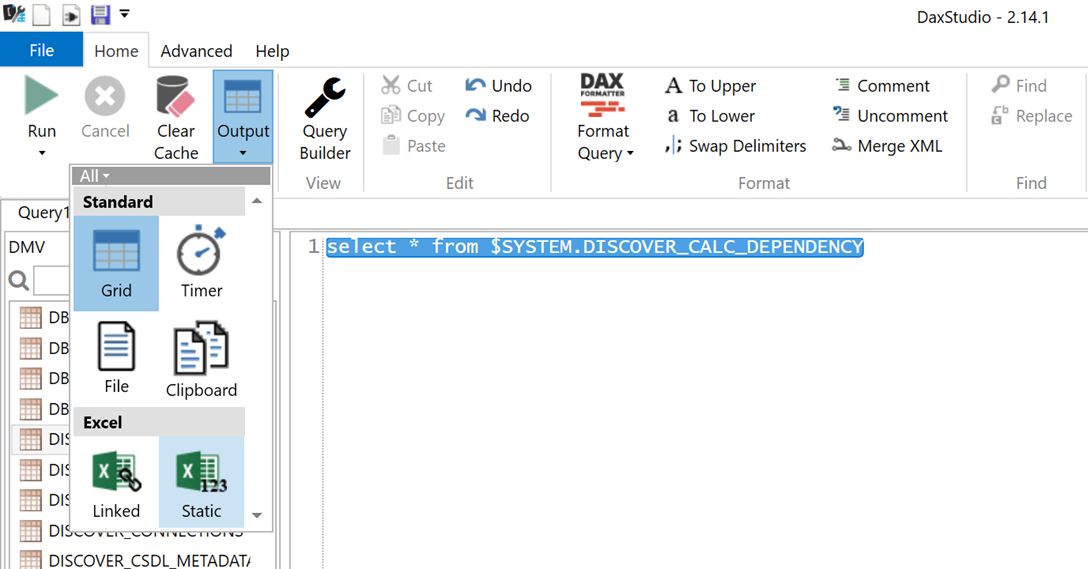
For this challenge my approach was to find how I can collect the information fast and easy. I did it with 3 advanced scripts that can be run with Tabular EditorAdvanced Scripting and 1 DMV that can be run with DAX Studio
Data Dictionary
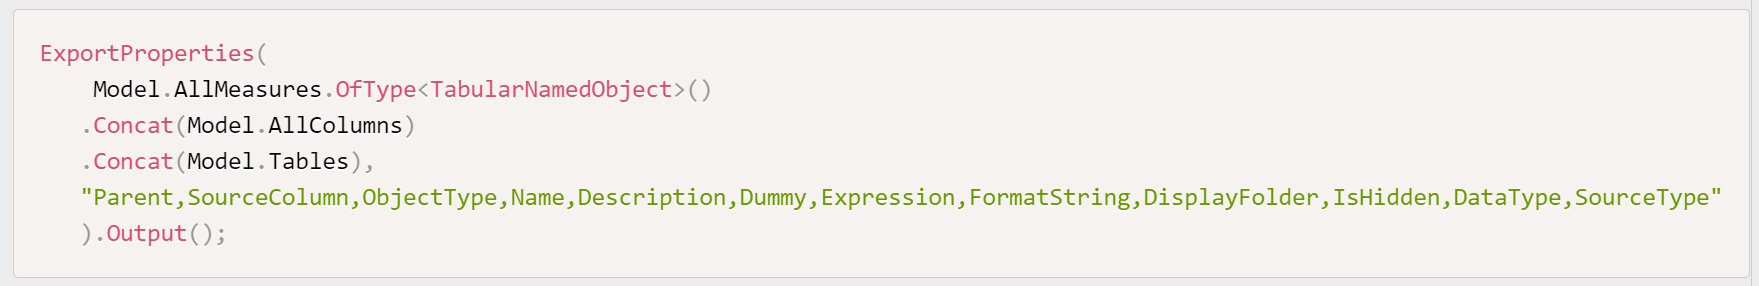
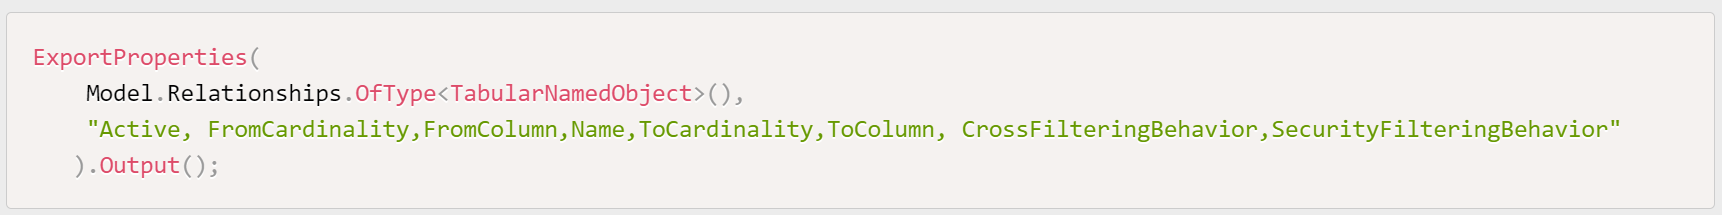
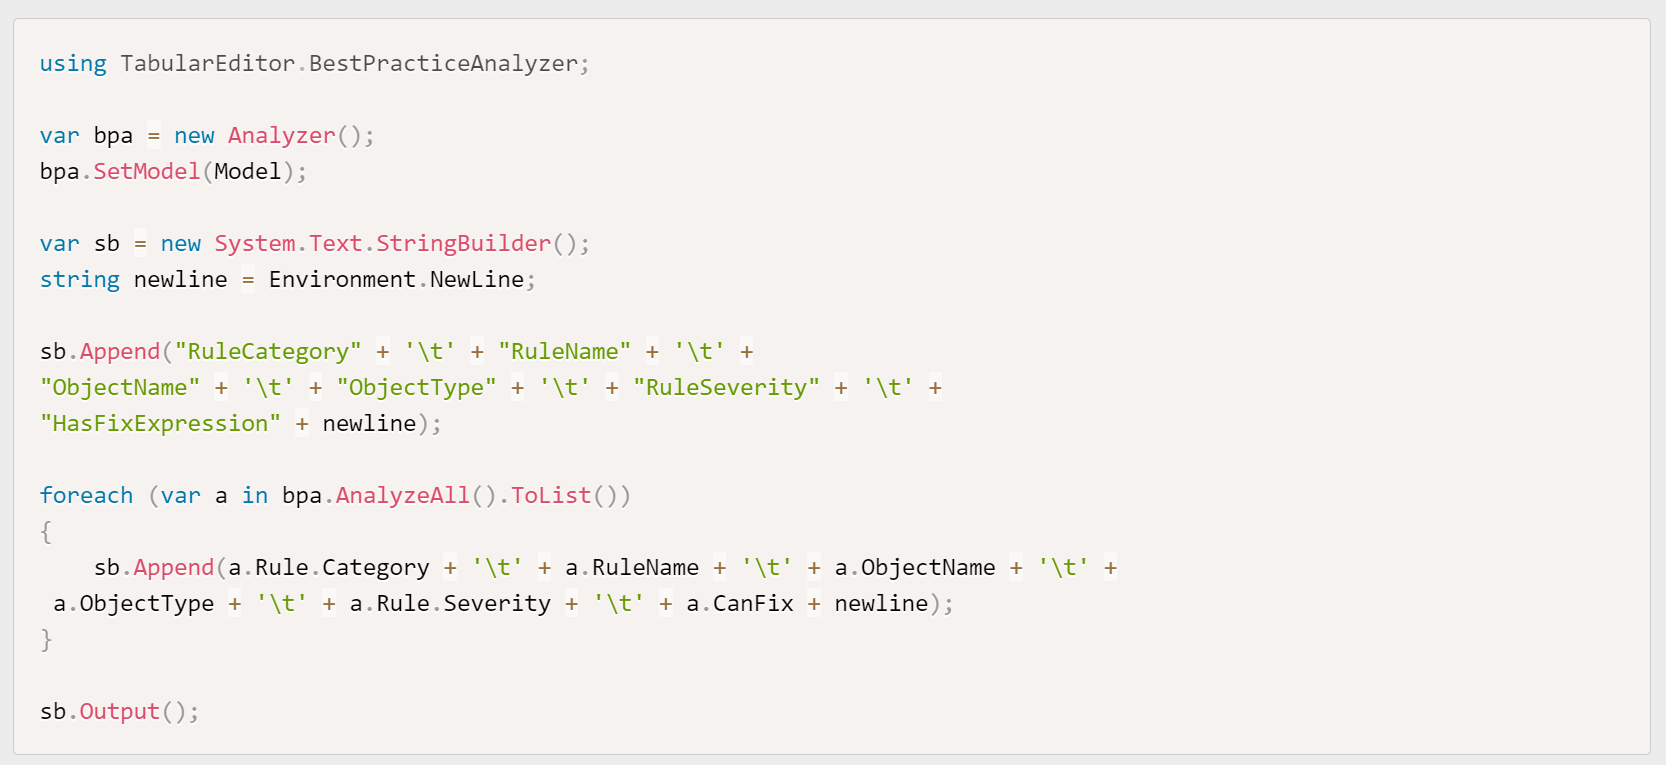
Tool: Tabular Editor
Advanced Scripting
Awesome job! Thanks very much for the detailed report. I’ve been trying to figure out how to automate the dependency mapping for my own documentation, and this is a really simple, elegant solution.