Reaching out with a question which initially seemed a simple question, but it turned out a nightmare.
I got a request to show on a chart the evolution by taking into consideration the last 21 working days for which data was extracted.
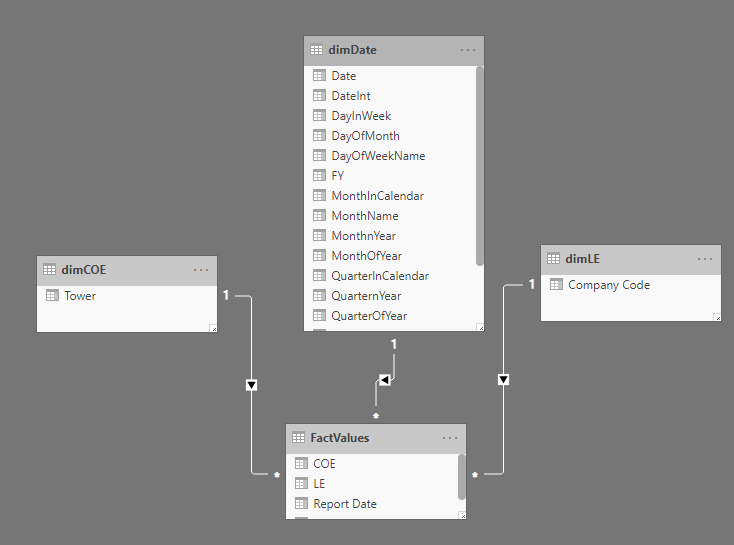
This means for each Report Date, I should go back with 21 working days for which we got data and do the cumulative average on the Values.
I’ve tried with the time intelligence, I will try it out also with DatesInPeriod, so far I’ve tried it with DateAdd and also indexing the report dates.
My struggle was to find a method which actually covers to check when rolling back 21 working days, if we have data for all those 21 days or we need to add more working days to reach the 21 days with data (report date).
In regards to the 21 Working Days, I added two formulas to your file that may help you.
The SUM of all the values. Even though it is a simple formula, it is always better to create a formula for it, that way you can refer it into more formulas later on.
Total Values =
SUM( FactValues[Value] )
The 21 Woking Days Average Formula:
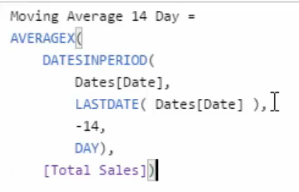
21 Working Day Average =
AVERAGEX(
DATESINPERIOD(
dimDate[Date],
LASTDATE( dimDate[Date] ),
-21,
DAY ),
[Total Values])
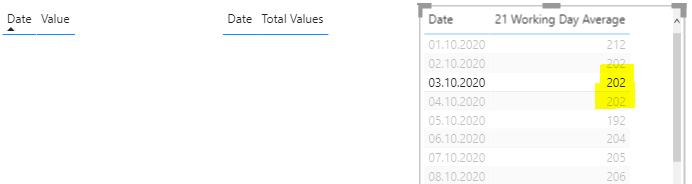
Note: The AverageX formula only counts the days that have values for the average expression.
In this case, the days 03.10.2020 & 04.10.2020 don’t have values thus the average value remains the same as 02.10.2020.
Hi @michaelsampsonidis
I think when we deal with working days we cannot rely on typical time intelligence formulas, the reason is that we can’t just subtract 21 days, we need to subtract 21 WORKING days! Furthermore, time intelligence uses continuous dates calendar, so using time intelligence would lead to a mistake.
Therefore my solution requires building a support table that contains the last 21 Working days. This table is not related so you can use the following measure
You are on the right track thinking that typical time intelligence does not apply. However, in my dimDate table, I have a column that is called IsWorkingDay that allows typical time intelligence to be applied. Here is my revised measure for the 21 Days Average:
                21 Days Average =
                CALCULATE (
                    AVERAGEX (
                        DATESINPERIOD ( dimDate[Date], LASTDATE ( dimDate[Date] ), -21, DAY ),
                        [Total Value]
                    ),
                    FILTER ( dimDate, dimDate[IsWorkingDay] = TRUE () )
                )
Here is a copy of the file. I also included your measure and table as a reference. Page 2 is where I have your measure and my revised measure shown.
Hi @michaelsampsonidis, a response on this post has been tagged as “Solution”. If you have a follow question or concern related to this topic, please remove the Solution tag first by clicking the three dots beside Reply and then untick the check box. Thanks!
Sorry mates I was busy at the weekend so I wasn’t able to develop the explanation.
Unfortunately, using Calculate (filtering working days) does not work in this case. You can compute the solution manually in Excel to test it.
The solution is to compute an AVERAGEX iterating over a working days table.
WorkingDaysOverTable =
VAR CurrentDate =
SELECTEDVALUE ( dimDate[Date] )
VAR FTable =
FILTER (
ALL ( LastWorkingDates ),
LastWorkingDates[Report Date] <= CurrentDate
)
VAR FilterTopTable =
TOPN ( 21, FTable, [Report Date] )
RETURN
AVERAGEX ( FilterTopTable, [Total Value] )
I have included the pbi file including the comparison with the Calculate +filter solution.
The reason why Calculate+filter does not work is interesting (If you know, please let us know). I know that Microsoft does not recommend using time intelligence for a non-continuous dates table. therefore. it is a good practice to solve this kind of problem using logic functions.EDNA- 21 Day Average Iterate over working days table.pbix (134.5 KB)First Help.xlsx (50.7 KB)