I am trying to find out average of last 5 trade days ( dates are not continuous due to weekends and holidays). To avoid time intelligence calculations ,I have taken an approach of index in query editor and based on which I have calculated average.
Though I get a desired result in a particular view, I get a different result when I re-structure it.
For your reference, I have attached a pbix file with just 2 symbols ( original file has 1000 odd symbols).
View 1 - This is the format I am looking for. select the date every day and you see average for all symbols in above table . But, 5DayTradeAverage value is incorrect.
View 2 - 5DayTradeAverage value is correct , but this is not the desired view am after.
Please advise which part of Measure is incorrect. Assuming the filter part.
There is also “TradeDates” table which I have included in pbix. I have tried using time intelligence way based on solution in Average Values - Last 21 Working Days , but I couldn’t get desired output. Probably, TradeDates has future dates too.
This one was definitely not easy, but I think I’ve got a working solution for you.
One of the problems with your initial approach was that you were not using a valid date table. In a valid date table, the dates have to be contiguous, and the table must be marked as a date table for time intelligence functions to work properly.
5 Day Avg 2 =
VAR SelDate =
    SELECTEDVALUE ( Dates[Date] )
VAR SelSym =
    SELECTEDVALUE ( 'nse_daily_data cm_full_bhavcopy'[SYMBOL] )
VAR BusDayTable =
    CALCULATETABLE (
        ALL ( 'nse_daily_data cm_full_bhavcopy' ),
        FILTER ( ALL ( Dates ), Dates[IsBusinessDay] = TRUE )
    )
VAR TopRecs =
    TOPN (
        5,
        FILTER (
            BusDayTable,
            'nse_daily_data cm_full_bhavcopy'[SYMBOL] = SelSym
                && 'nse_daily_data cm_full_bhavcopy'[DATE] <= SelDate
        ),
        'nse_daily_data cm_full_bhavcopy'[DATE], DESC
    )
VAR Result =
    AVERAGEX ( TopRecs, 'nse_daily_data cm_full_bhavcopy'[Trade Ratio] )
RETURN
    Result
I would like to provide another solution, which is a standard rolling average calculation of 7 days, (assuming 5 trading days are in one week), taken into account provided holidays. with the use of a standard date table; no need to use Index in the fact table at all.
Slightly adjusted source data for this workout, with Trade Ratios in the weekends . SourceData 5 Days av.xlsx (41.8 KB)
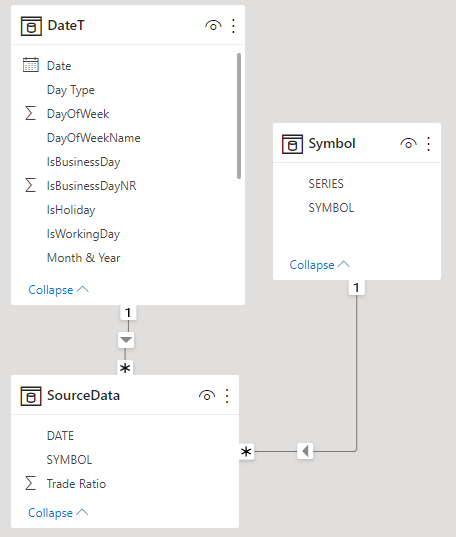
Use the standard date table (setup by Melissa), whereby a list of holidays could be imported, resulting in business days (business days excludes the weekends and the imported holidays)
See the query “DateTableMelissa” in Power Query, not needed columns hided.
Adjust the data model, no need for an index column in the fact-table
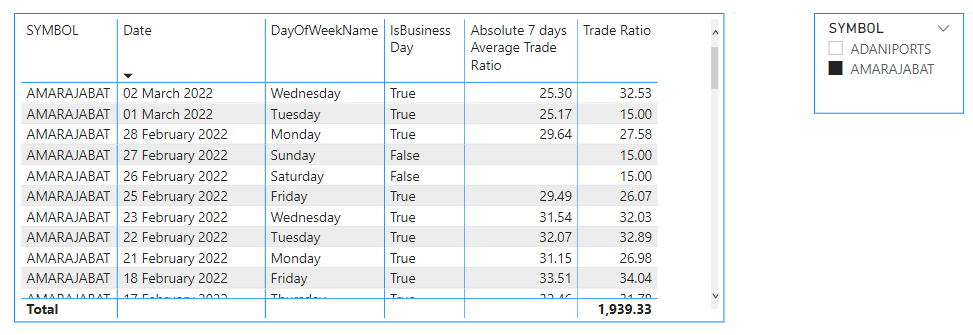
Create a standard rolling average measure, which filters on Business days, the measure is however based upon an absolute rolling backwards period (in this case 7 days).
No averages presented for the weekends nor for days with no Trade Ratio"
Absolute 7 days Average Trade Ratio =
Var AvTradeRatio = calculate(AVERAGE(SourceData[Trade Ratio]),
                           DATESBETWEEN(DateT[Date],MAX(DateT[Date])-7 + 1, max(DateT[Date])),DateT[IsBusinessDay] = TRUE())
return
if(or(max(SourceData[Trade Ratio])= BLANK(), MAX(DateT[IsBusinessDayNR]) = 0), BLANK(), AvTradeRatio)  --blank Av, when a date has no Trade Ratio or is not a business day (when context date is in the report)
The reports can be found in pages View 1 and View 2, one report below
Thank you for your time experts @BrianJ and @deltaselect in providing work around and solutions. Initial test shows @BrianJ solution providing the desired solution. Will do further study on @deltaselect solution and understand where it is going wrong.
Hi @yopad
Just be aware that I slightly adjust your test-data (delete a ratio and change a ratio and add weekend ratios) to show effects in the report; changing /deleting a ratio on working days explains differences with your original sample average trade ratio calculation.
PS: holidays are not imported.
Kind regards, Jan vd Wind
Yes, I did notice that (adjusting test data). But i did test after deleting weekend ratios which is why not the desired output. If this solution needs to have weekend ratios, it may not be suitable for this data set as I have 1000+symbols each day.
Brian’s method always take the last 5 available trade ratios for calculating the average, which is asked.
Whereby my method only take an average based upon the last 7 days, which in fact is an average of the available trade ratios in the last 7 days, which could be less then 5. With a week of holidays, no average trade ratio will be presented at all, which is not correct.