Yahoo Finance API setup in Power BI (Stocks & Shares)

Sounds interesting
Here are some links to get you started :wink:.

1 Like

HI @BrianJ,

You can get stock symbols from the following website with current price and company name using API. It is very easy to integrate with Power BI. May be first 250 requests are free if you register. I have used it previously and I was available to get a lot of information which was required very quickly.

Kind Regards,
Hafiz

2 Likes

@hafizsultan,

Thanks! In the video I did yesterday, the stock quote “app” gets the list of stocks to iterate over from an Excel file. However, to take that to the next level, it would be cool to embed a PowerApp into that report, where you could enter the list of companies and have the app do the symbol lookup via this API.

I’m just starting to learn PowerApps, so this might be a cool learning project and a good follow on video. Just not enough hours in the day…

  • Brian
2 Likes

@Melissa,

Thanks! I have the Raviv book but haven’t worked my way nearly up to Ch 9 yet. I think your “V” pattern recognition approach from Challenge 5 will be very useful here.

@Krays23 - I’m assuming we’d work through this publicly on the forum where others could learn and/or participate. Just wanted to make sure that was your expectation as well.

  • Brian

Sure why not ! were here to help each other right?

I know the main patterns to look for that are the most powerful share pattern indicators. So then it becomes all about if we can get Power BI to recognize those patterns and highlight to us stocks that are showing signs of these patterns.

I would suggest we start with one pattern like the double bottom and the Fibonacci rule then get that working correctly and go from there.

When can you share the PBIX you have so far that gives us the Shares we want to look at with the criteria like volumes, highs and lows, closing and opening prices?

Cheers

Dan

@Krays23,

Here you go. I did the video at weekly granularity rather than daily, but here’s how to change it back to daily:

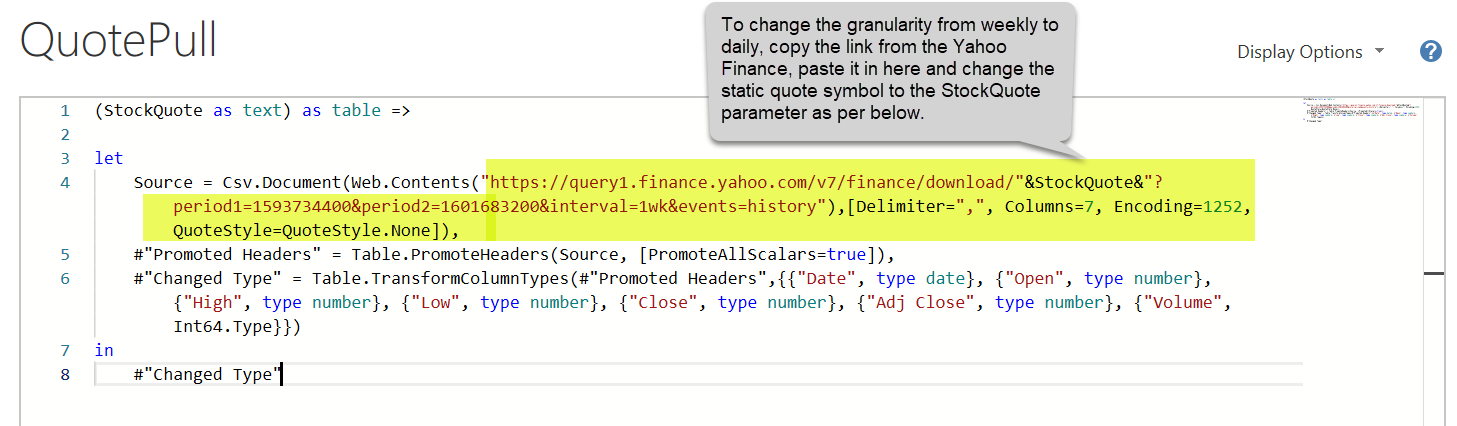
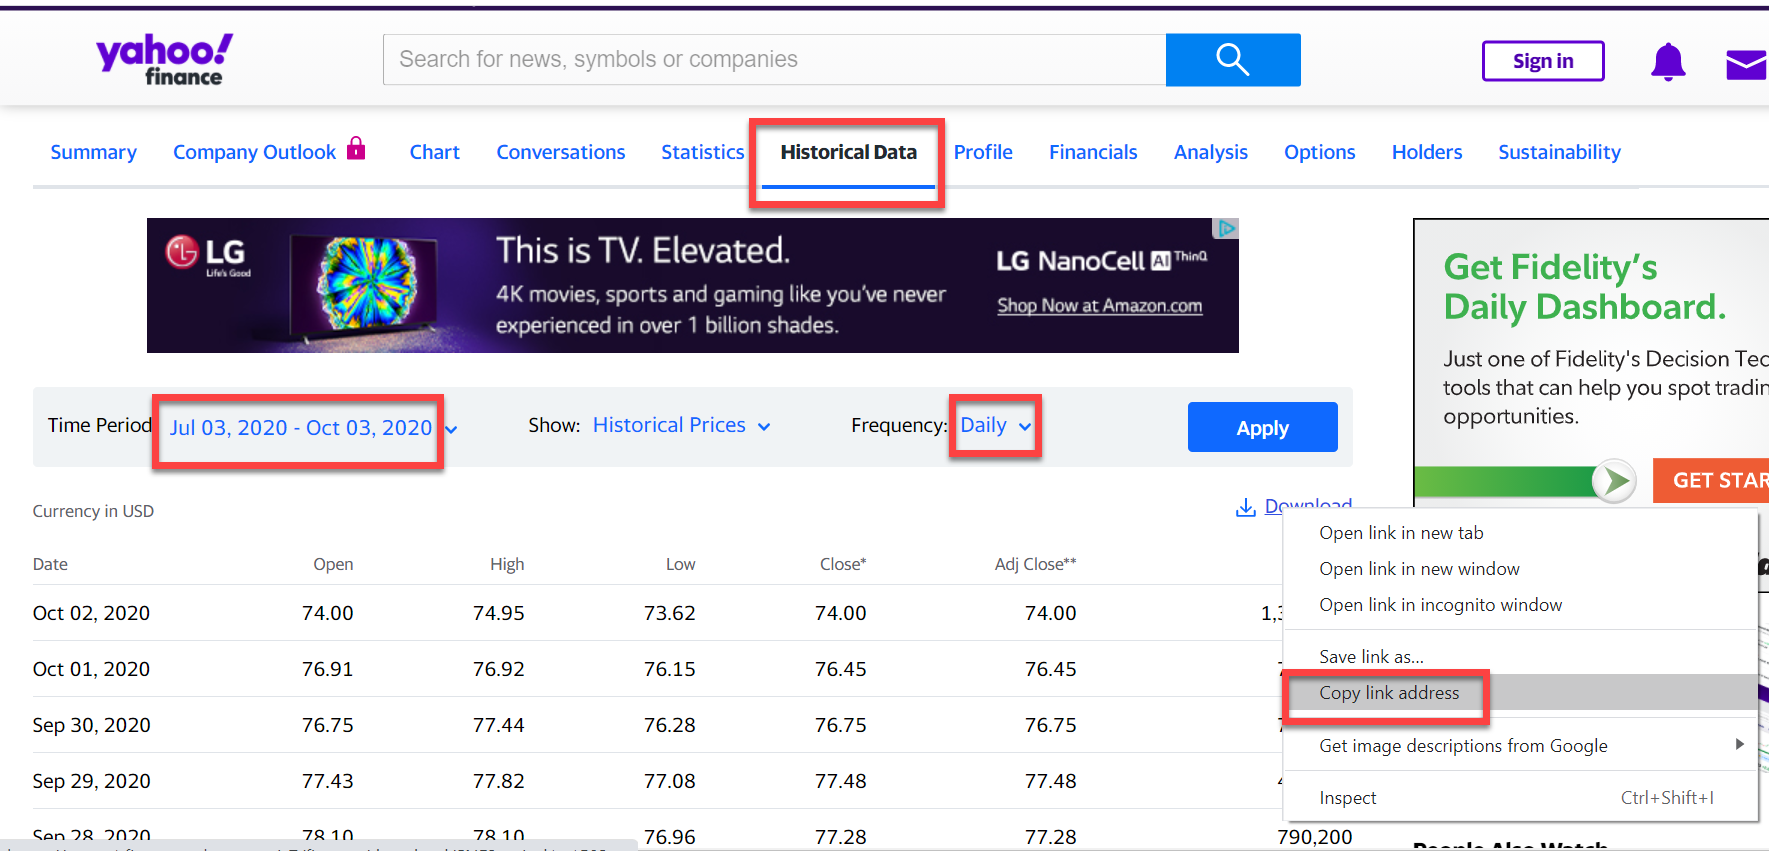
and here’s the visual:

The video hopefully will make this crystal clear. It has to go to the editor first, but I expect it will probably post late this week.

If we wanted to get fancy, we could also parameterize the granularity and the time period, so we wouldn’t have to go back to the Yahoo Finance site to do this, but I wanted to keep the video to a reasonable length. To do it, we’d just follow the exact same process used to parameterize the stock quote.

Hope you find this helpful.

P,S, Here’s @Melissa’s awesome writeup of Challenge #5 entry explaining her pattern recognition algorithm:

and here’s her post with the recursive function she wrote but didn’t use for that entry (I think the Little League mercy rule got invoked, and the game got called when she was already up by 15 runs after three innings :grin:):

Great ill take a look later im in UAE so time zones are a bit erratic lol.

We need the data daily and have the ability to change the charting to various options like yahoo and Google finance

As follows is the normal standard

All dates
2 yearly
Yearly
Qrtly
Monthly
15 days
7 days
Daily

Are the defaults we would need to be able to analyse patterns effectively.

The format / layout of the vizulisation that Sam used in the stock market showcase looks perfect aswell maybe we can take his layout and add to it your work.

Regards

Dan

@Krays23,

OK, it’s cool how this is shaping up. All we’d need to do is add @Melissa’s extended date table to the data model, change the granularity of the data pull to daily, the period to Max, and then add a custom period slicer to the report with the periods you listed above other than All Dates, since that will be our default state.

I just talked with @JarrettM yesterday, and he’s going to be doing a couple of videos on how to create the custom period slicer. I’ll chat with him, and see if maybe he can use this as his example in working through the process in the video.

  • Brian
1 Like

@Krays23,

OK, I added the Extended Date table, made it dynamic based on the dates in the fact table (started at Jan 1 of the first year in the fact table, ended at Dec 31 for last year in fact table), and changed the QuotePull granularity to daily and the period to 5 years.

All Dates is not going to work dynamically, since that range is different for every stock. Is there a set # of years back from the current date that would be sufficient for this? I still need to understand how Yahoo sets the start and end dates for the specified period in order to make this fully dynamic, but what I’ve attached should be sufficient for you to change the visualization to whatever you’d like it to be, and for @JarrettM to add the period slicer if he wants to do that through the video series, otherwise we can add it.

Thoughts?

Hi @All

Wow :star_struck: such a good initiative it’s going to be a lot of learning here, same as the other challenges. Have always heard the 2 word in trading - Fundamentals and Technical but haven’t got into it so I think it’s time to learn little about it and then leverage on the discussion here…

Thanks
Mukesh

@MK3010,

Yeah, jump in! I haven’t done much of this either, having learned early in my investment experience that I was bad at stock picking, so I focused my analytics on sports betting instead… :grinning:

  • Brian

To be honest mate 2 years is enough when doing technical analysis 2 years is plenty.

Great start guys now to look at how we dynamically find the resistance and support levels dynamically from this should be easy to recognise patterns like channeling and reversals like double tops and bottoms we need these to be dynamically based on dates we select for the Chart.

Once we have the resistance levels and support levels we can apply the Fibonacci rule to it.

Let’s see how we go

Please feel free to get involved anyone in the group here. Knowledge is power

1 Like

@Krays23,

I’ll be working with @BrianJ to get the Period Table added with the date ranges you need. Love what you are doing here. From 2004 to 2010 I traveled for work teaching people how to trade the stock market, mainly options trading. Very familiar with charting and technical analysis. I was a big fan of using Fibonacci in my charting software.

Thanks
Jarrett

3 Likes

@JarrettM great!!! welcome aboard! lets get this done

@Krays23,

On the date ranges, you only want trading days (M-F), or is it ok to include dates that are non trading days?

Thanks
Jarrett

@JarrettM,

Awesome – I’ll take what you’ve done and work on getting the Yahoo query dynamic from the current date back two years, and then we can adjust the code for the period slicer. Had no idea you used to do this for work - this forum never ceases to amaze me.

@Krays23 - just curious, do you do this for work or is this just a personal side project?

  • Brian
1 Like

Wow what an impressive thread.

There’s so much value here and about 3-4 videos of content easily.

Nice work everyone.

Sam

2 Likes

Even more so when we figure out how to have PBI identify the key reversal patterns and get the Fibonacci rule working correctly hopefully.

There’s paid charting software out there called winway charts that is no where near as good as what we can get PBI to do in my opinion. As always the beauty of PBI is that once the model is there we can update it to suit our own preferences.

Great team work as always here many thanks everyone. You showcase inspired me to write this thread @sam.mckay

Just side work / Fun @BrianJ to pay for the life style …lol

1 Like

I have added my up FTSE and S&P 100 watch list to the stock symbols for anyone who wants a look.

I think we should use BATS as the pilot schema here as I’m sure they will be up at 4000 USD again by the end of 2020 if you look they already have done 2 recent Fibonacci moves and possible entering the third now for anyone who wants to take a tip.

I also changed it to a line graph and added max min lines and trend temporarily as its easier to see the patterns than candle sticks. Candle sticks are better for day trading than swing trading. Swing trading stick to 4 to 5 weeks share holdings and set the graph to 15 days view.

See what you guys can do to get the pattern identifiers working.

Cheers

DaneDNA Forum - Chartist Stock Analysis v1.pbix (1.2 MB) StockList.xlsx (9.3 KB)