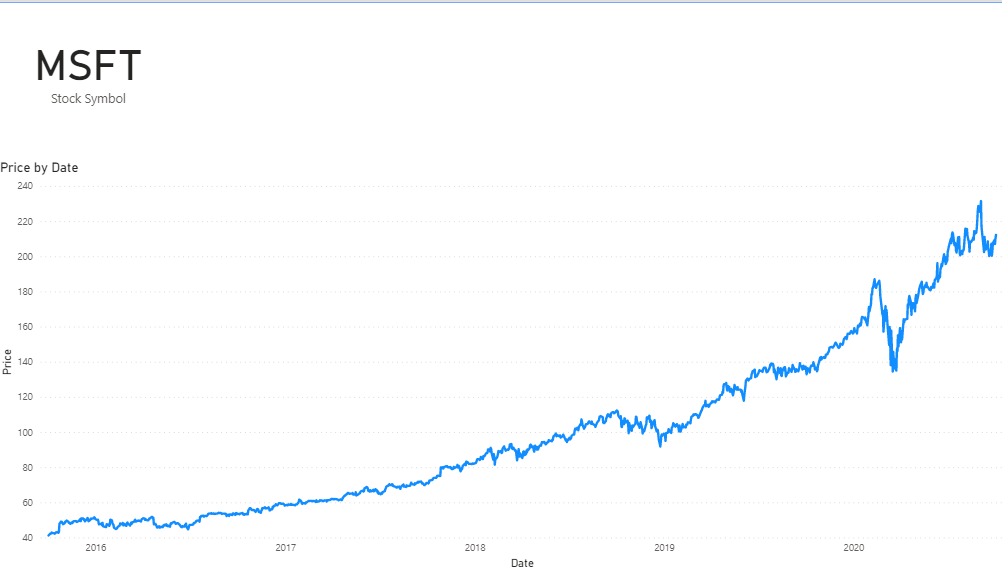
@Krays23,
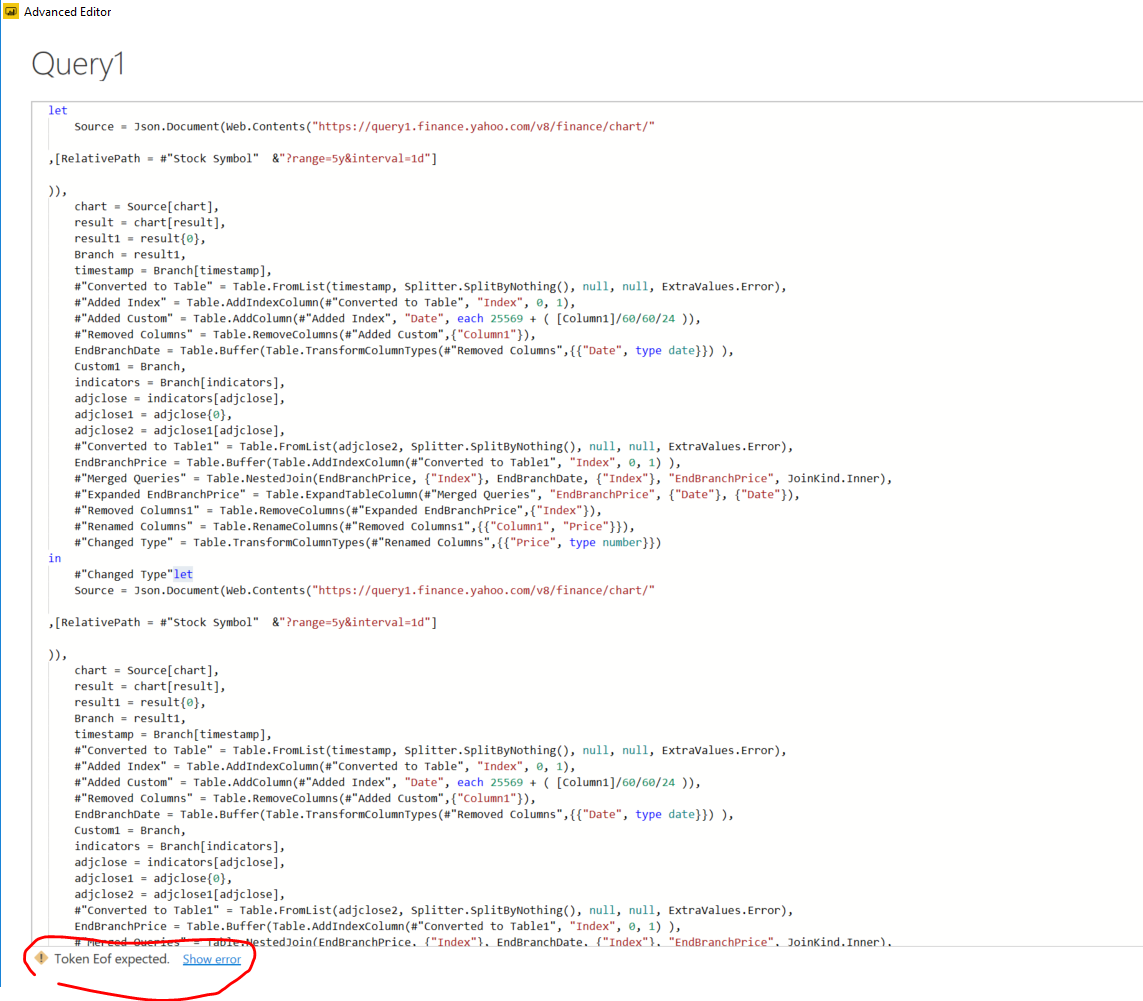
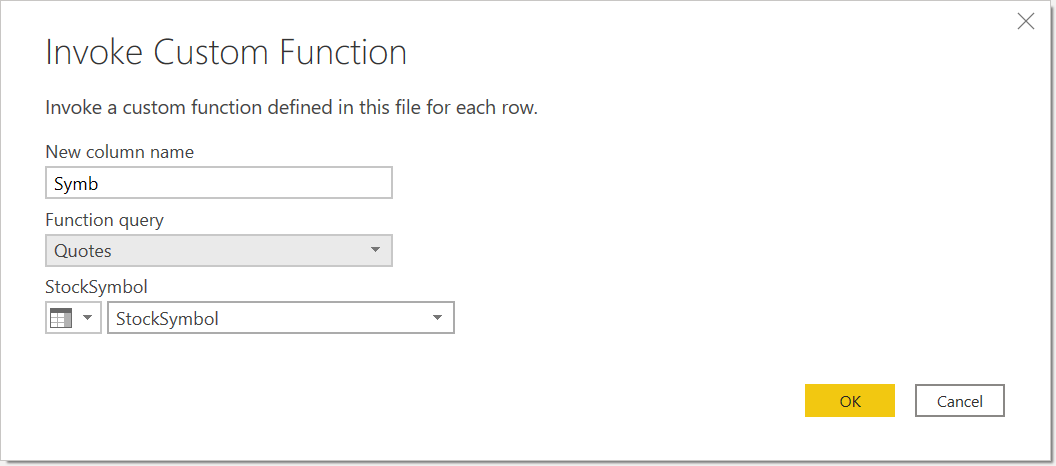
See if this works for you:
let
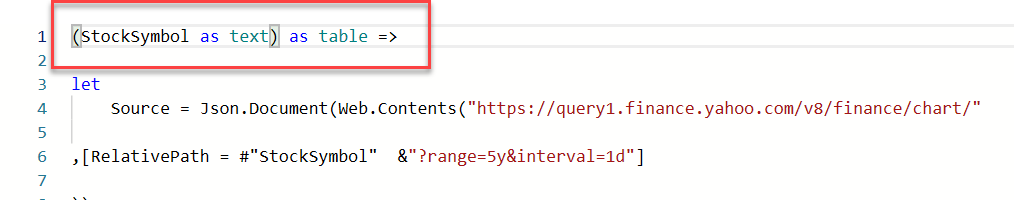
Source = Json.Document(Web.Contents("https://query1.finance.yahoo.com/v8/finance/chart/"
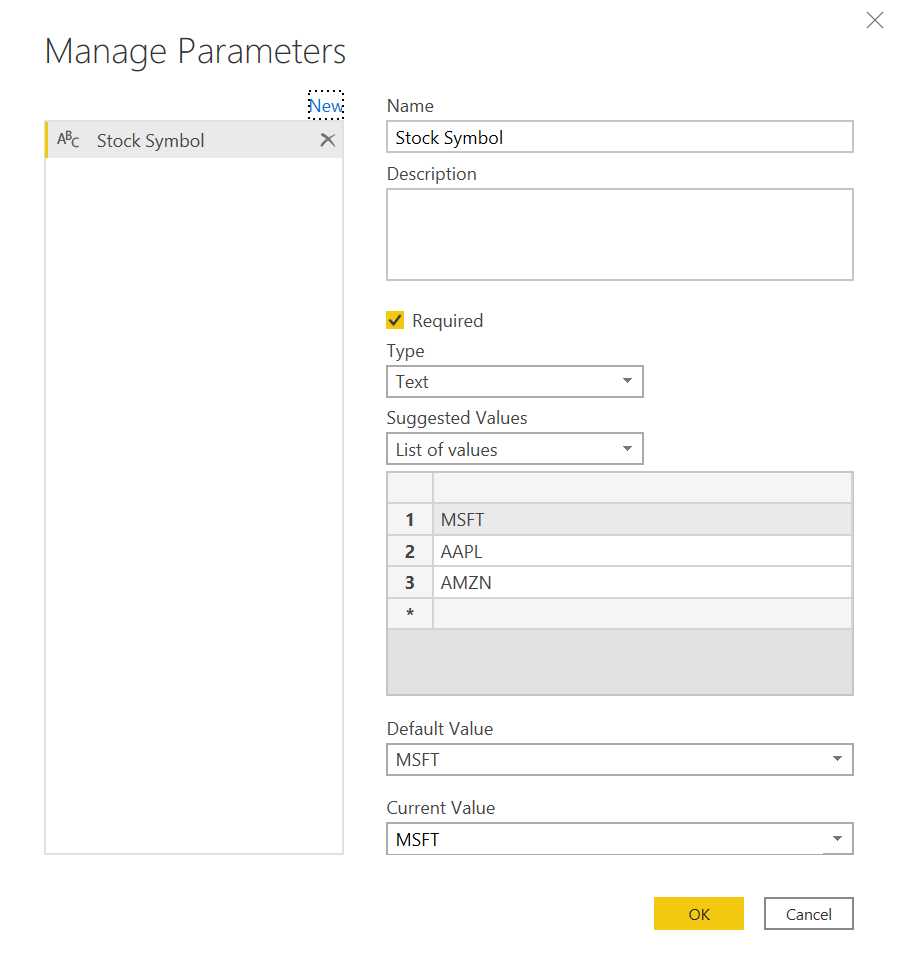
,[RelativePath = #"Stock Symbol" &"?range=5y&interval=1d"]
)),
chart = Source[chart],
result = chart[result],
result1 = result{0},
Branch = result1,
timestamp = Branch[timestamp],
#"Converted to Table" = Table.FromList(timestamp, Splitter.SplitByNothing(), null, null, ExtraValues.Error),
#"Added Index" = Table.AddIndexColumn(#"Converted to Table", "Index", 0, 1),
#"Added Custom" = Table.AddColumn(#"Added Index", "Date", each 25569 + ( [Column1]/60/60/24 )),
#"Removed Columns" = Table.RemoveColumns(#"Added Custom",{"Column1"}),
EndBranchDate = Table.Buffer(Table.TransformColumnTypes(#"Removed Columns",{{"Date", type date}}) ),
Custom1 = Branch,
indicators = Branch[indicators],
adjclose = indicators[adjclose],
adjclose1 = adjclose{0},
adjclose2 = adjclose1[adjclose],
#"Converted to Table1" = Table.FromList(adjclose2, Splitter.SplitByNothing(), null, null, ExtraValues.Error),
EndBranchPrice = Table.Buffer(Table.AddIndexColumn(#"Converted to Table1", "Index", 0, 1) ),
#"Merged Queries" = Table.NestedJoin(EndBranchPrice, {"Index"}, EndBranchDate, {"Index"}, "EndBranchPrice", JoinKind.Inner),
#"Expanded EndBranchPrice" = Table.ExpandTableColumn(#"Merged Queries", "EndBranchPrice", {"Date"}, {"Date"}),
#"Removed Columns1" = Table.RemoveColumns(#"Expanded EndBranchPrice",{"Index"}),
#"Renamed Columns" = Table.RenameColumns(#"Removed Columns1",{{"Column1", "Price"}}),
#"Changed Type" = Table.TransformColumnTypes(#"Renamed Columns",{{"Price", type number}})
in
#"Changed Type"let
Source = Json.Document(Web.Contents("https://query1.finance.yahoo.com/v8/finance/chart/"
,[RelativePath = #"Stock Symbol" &"?range=5y&interval=1d"]
)),
chart = Source[chart],
result = chart[result],
result1 = result{0},
Branch = result1,
timestamp = Branch[timestamp],
#"Converted to Table" = Table.FromList(timestamp, Splitter.SplitByNothing(), null, null, ExtraValues.Error),
#"Added Index" = Table.AddIndexColumn(#"Converted to Table", "Index", 0, 1),
#"Added Custom" = Table.AddColumn(#"Added Index", "Date", each 25569 + ( [Column1]/60/60/24 )),
#"Removed Columns" = Table.RemoveColumns(#"Added Custom",{"Column1"}),
EndBranchDate = Table.Buffer(Table.TransformColumnTypes(#"Removed Columns",{{"Date", type date}}) ),
Custom1 = Branch,
indicators = Branch[indicators],
adjclose = indicators[adjclose],
adjclose1 = adjclose{0},
adjclose2 = adjclose1[adjclose],
#"Converted to Table1" = Table.FromList(adjclose2, Splitter.SplitByNothing(), null, null, ExtraValues.Error),
EndBranchPrice = Table.Buffer(Table.AddIndexColumn(#"Converted to Table1", "Index", 0, 1) ),
#"Merged Queries" = Table.NestedJoin(EndBranchPrice, {"Index"}, EndBranchDate, {"Index"}, "EndBranchPrice", JoinKind.Inner),
#"Expanded EndBranchPrice" = Table.ExpandTableColumn(#"Merged Queries", "EndBranchPrice", {"Date"}, {"Date"}),
#"Removed Columns1" = Table.RemoveColumns(#"Expanded EndBranchPrice",{"Index"}),
#"Renamed Columns" = Table.RenameColumns(#"Removed Columns1",{{"Column1", "Price"}}),
#"Changed Type" = Table.TransformColumnTypes(#"Renamed Columns",{{"Price", type number}})
in
#"Changed Type"
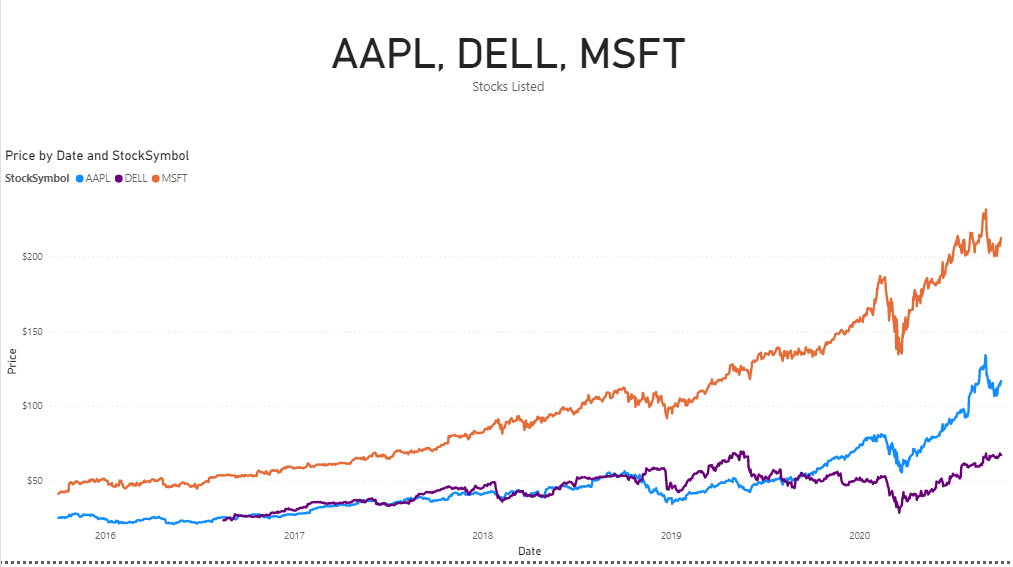
Solution based on this article:
https://powerbi.tips/2019/10/historical-stock-price-function-in-power-query/
Full solution file attached below. I hope this is helpful.