I am attaching pbix file, i am working on variance analysis between one year to another year and developed a format for waterfall chart using Sam example of financials format.
I have developed selected variable dax and the information comes correctly based on the format designed.
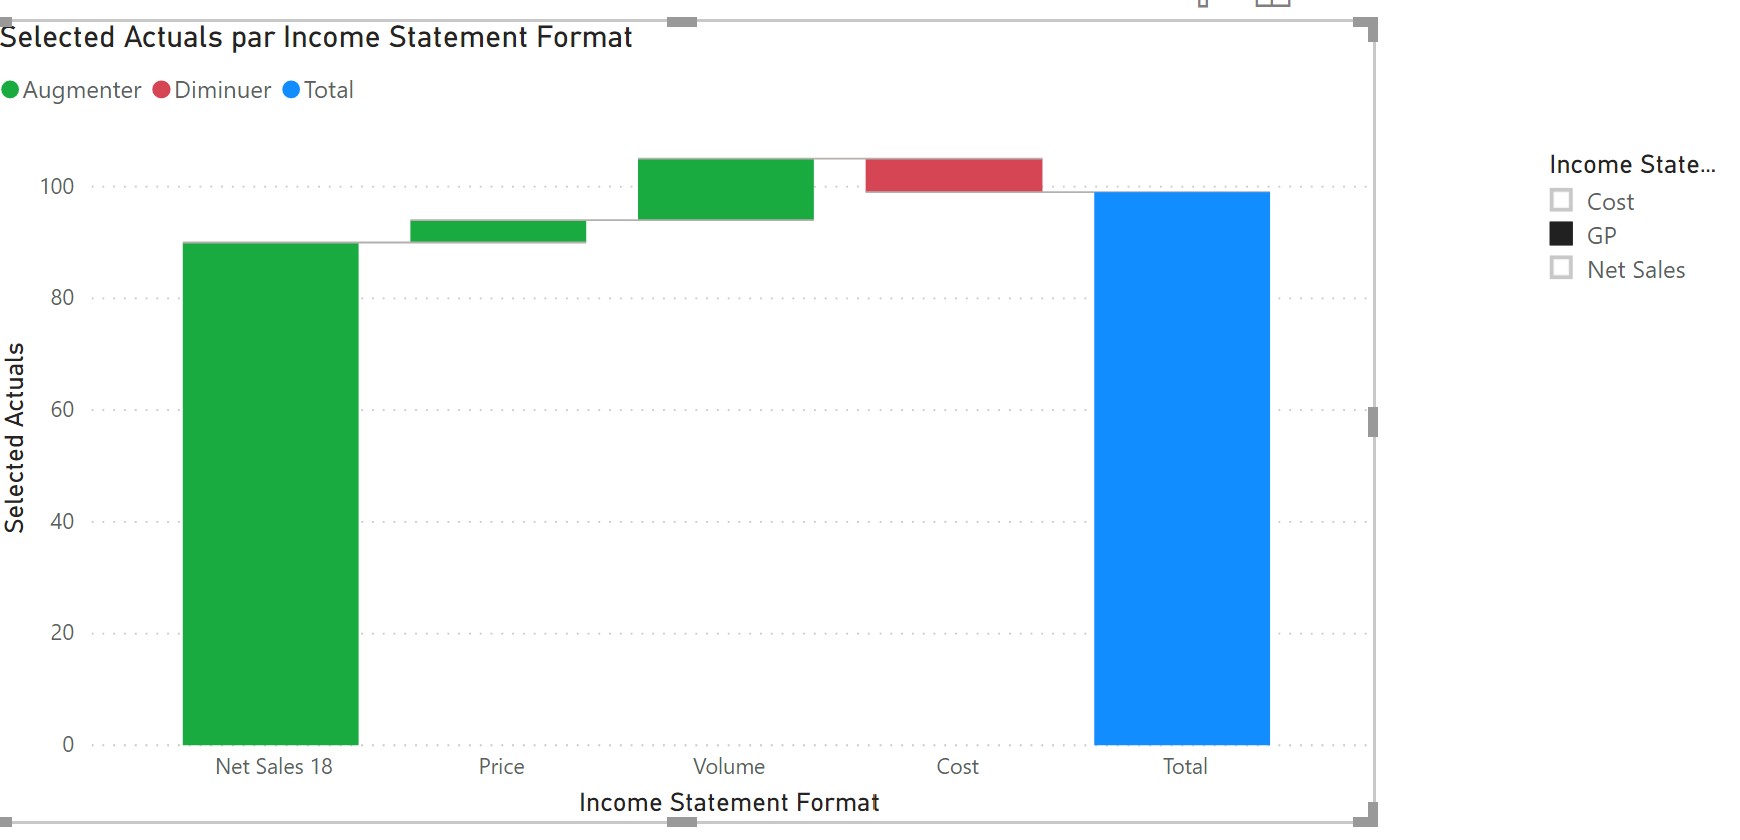
When iam using the information on the waterfall visualization the visual is not appropriate, i do not want to see the total and the bridge items should show before Net sales 2019, the sequence should be based on the index i developed. So that i can see- Net Sales 18, Price, Volume, Cost and Net Sales 19. Do not worry on the nomenclature.
appreciate if somebody can help, it maybe simple but i am unable to crack it, i am working over the weekend to develop a waterfall chart that i plan to present on Monday. help will be appreciated,
To sort the waterfall chart by “Income Statement Format” you need to click on the ellipses of the visual and click “Ascending” and then “Sort by”.
I guess you would have sorted Format[Income Statement Format] by the Index column beforehand.
I didn’t find a clean way to hide the total. My two options are:
Turn the color of the total Data Label into White, then you won’t see on the visual but the “Total” label will remain below
Widen the width of the X-axis categories, then by reducing the size of the visual the “Total” will not be visible. But the downside is that you will get a scroll bar below.
This is the technique I used in the .pbix hereby attached.
how do it get the Net Sales 19 down , my waterfall chart was essentially to show the bridge from Net Sales 18 to Net sales 19. Is it possible to show it down?
Strangely Power BI does not yet offer good alternatives to advanced Waterfall charts yet.
If the “Total” label bothers you and you would prefer to have “Net Sales 19” instead, you can hide it with a text box or button which you will group with the visual. This will yield this result:
thanks, this does help, since i am unable to download any other official apps other than the power bi, our company does have a restrictive policy, i am curious as to why Microsoft has not inbuilt advanced waterfall charts to cover for the some nuanced analysis.
Your help is highly appreciated, i will be working on it today and get back if i need further help, as you can see i am a newbie, so will take some time.
It’s great to know that you are making progress with your query @krish1712. Please don’t forget if your question has been answered within the forum it is important to mark your thread as ‘solved’. Also, we’ve recently launched the Enterprise DNA Forum User Experience Survey, please feel free to answer it and give your insights on how we can further improve the Support forum. Thanks!