Visual like teams calendar in Power BI

Hi Data Expert Team,

There is one urgent client requirement to build a Power BI report to visualize the organization’s internal task list.
So in team’s calendar shows the meeting for each day and time, a little similar visual client is looking for.
So are there any possibilities to achieve or visual available for Power BI

Please find the attached image

Your help is highly appreciated

Best Regards
Pijush

Hi @PijushRoy. Deneb could produce such a matrix quite easily, but likely would have rudimentary (compared with Teams calendar) interactivity. I’ll make up a small dataset and give it a whirl, but please state all filter and interactivity requirements. Also, is this a calendar for one person/team or many? If many, how are they to be presented? One at a time? More details please.
Greg

1 Like

Hi @Greg

Very thanks for looking into the topic and prompt reply.
The report is for one person (if required, multiple reports for different person)

Kindly provide one sample with Deneb, it will greatly help

Thanks a lots

Regards
Pijush

Hi @Greg

Please help

Hi @PijushRoy

Here’s a first rough draft of a weekly calendar using a small, made-up dataset and Deneb/Vega-Lite:

This represents about 3 hours work (for myself, an accomplished Deneb/Vega-Lite developer), so a full solution would be a not-insignificant development effort. Some of the items/features that should be developed in the future include:

  • support for task types (e.g., confirmed, tentative, meeting, etc.)
  • support for multi-hour tasks
  • support for multi-day tasks

Before going any further, it would be a good idea to have you say if we’re heading in the right direction at all. If so, in order to develop a more complete solution, I’d need:

  • a sample dataset showing the type of record similar to that actually available from the client
  • a complete statement of the requirements for the visual (Deneb/Vega-Lite is extremely customizable, but on the flip-side you need exhaustive requirements)

If I am on the right track and you’d like further development, please say so and provide a sample dataset and requirements. (I’ve attached my small made-up dataset for your reference.) It’s the weekend and I have other commitments, but will try to generate a 2nd version later today.

Hope it helps.
Greg
Tasks.xlsx (9.4 KB)

2 Likes

Thank You so much @Greg and the developer team
That is an incredible effort.

The task is almost the same for all weeks but it will include Saturday and Sunday as well. If a task is for 30 minutes or 15 minutes, if we can highlight this portion in place of a full hour, it will be awesome.

I have completed the Deneb course and looking into the other Deneb events that are available on the Enterprise DNA website.
The course is very very helpful. Thanks @Greg

I am excited and waiting for the next version.
If you please share JSON template, I can look and learn the process.

Thank you very much for your prompt support

Best Regards
Pijush

Hi @PijushRoy

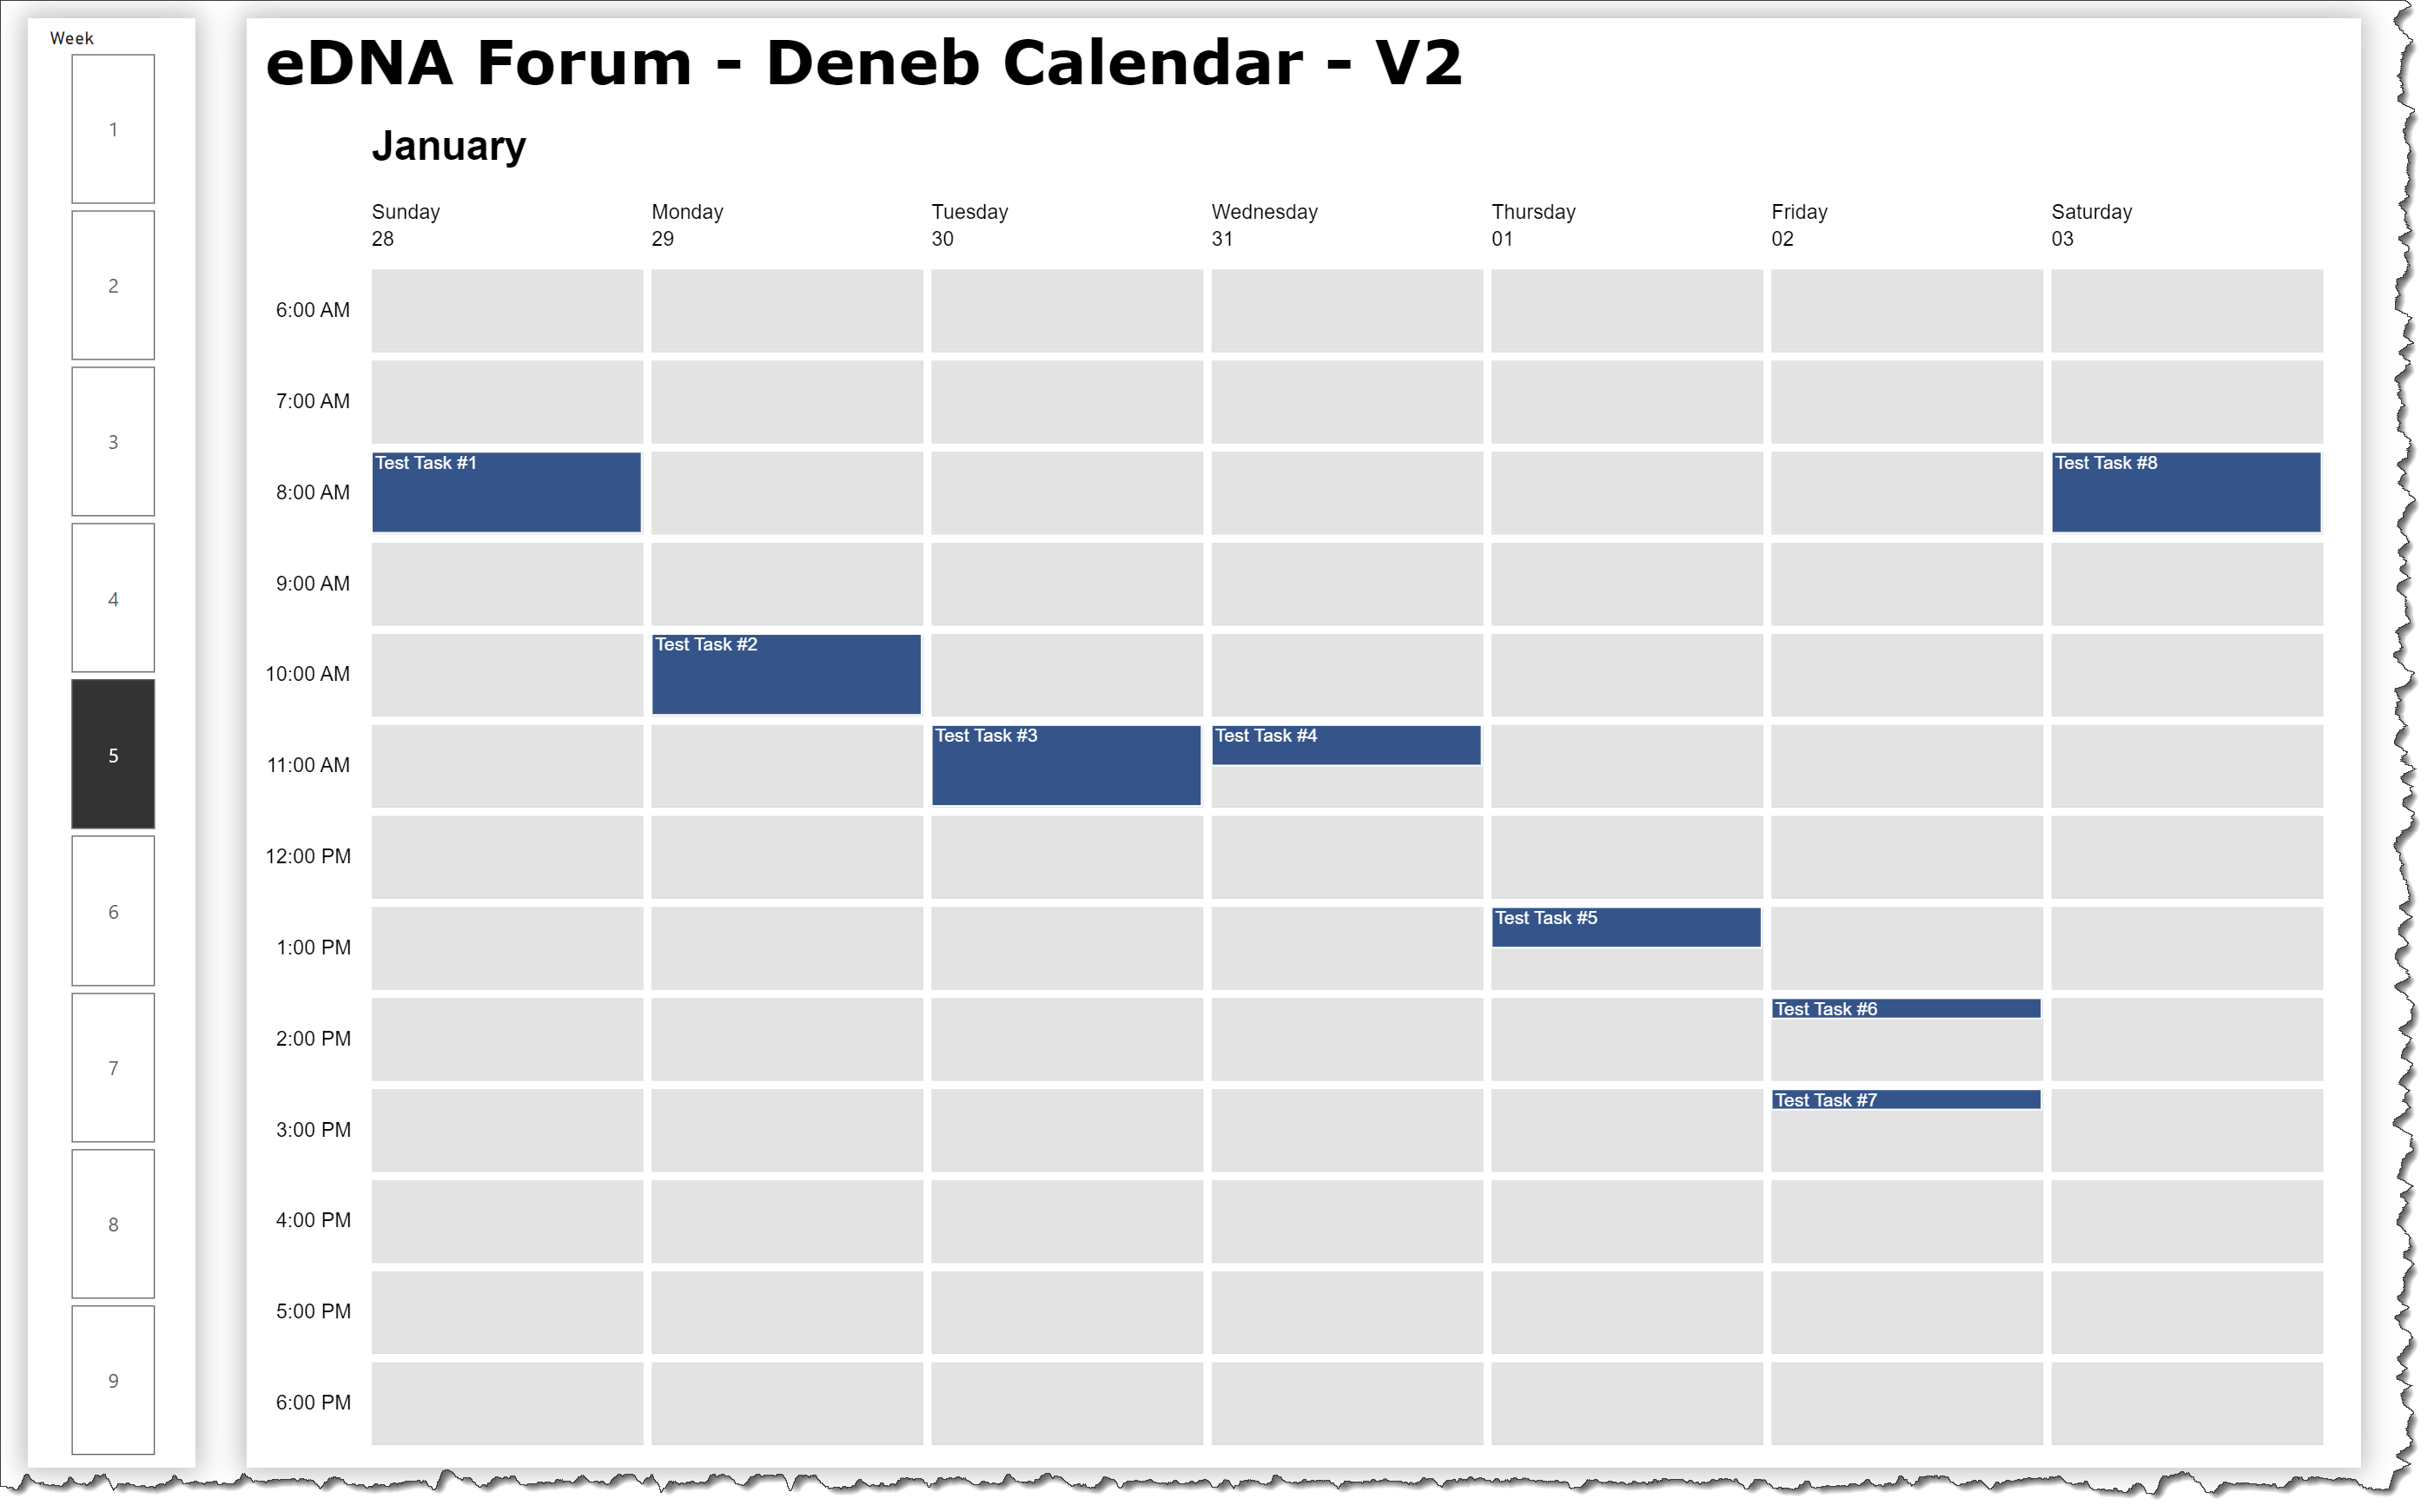
OK, here’s V2 with 1/4 and 1/2 hour displays and using the same colouring for weekends and weekdays:

This draft is essentially just:

  • a title block
  • a transform block (to calculate month, day, and hour values)
  • a params block (to set the colours)
  • a vconcat block for month title and weekly calendar
  • in the weekly calendar block:
    • a facet block (i.e., small multiples) with:
      • days for columns
      • hours for rows
    • a layer block with:
      • a “rect” mark for the full-height background
      • a “rect” mark for the variable-height foreground
      • a “text” mark for the task notes

Here’s the JSON specification code:

{
  "title": {
    "anchor": "start",
    "align": "left",
    "offset": -10,
    "text": "eDNA Forum - Deneb Calendar - V2",
    "font": "Verdana",
    "fontSize": 36,
    "fontWeight": "bold",
    "fontStyle": "normal"
  },
  "data": {"name": "dataset"},
  "transform": [
    {
      "calculate": "month(datum['DateTime'])",
      "as": "_month"
    },
    {
      "calculate": "monthFormat(datum['_month'])",
      "as": "_month_name"
    },
    {
      "calculate": "day(datum['DateTime'])",
      "as": "_day_of_week"
    },
    {
      "calculate": "timeFormat(datum['DateTime'], '%d')",
      "as": "_day_of_month"
    },
    {
      "calculate": "dayFormat(datum['_day_of_week'])",
      "as": "_day_name"
    },
    {
      "calculate": "datum['_day_name'] + '|' + datum['_day_of_month']",
      "as": "_day_label"
    },
    {
      "calculate": "hours(datum['DateTime'])",
      "as": "_hour"
    },
    {
      "calculate": "timeFormat(datum['DateTime'], '%I')",
      "as": "_hour_padded"
    },
    {
      "calculate": "timeFormat(datum['DateTime'], '%-I:%M %p')",
      "as": "_hour_name"
    },
    {
      "calculate": "datum['_hour_padded'] + '_' + datum['_hour_name']",
      "as": "_hour_label"
    },
    {
      "filter": {
        "field": "_hour",
        "range": [6, 18]
      }
    }
  ],
  "params": [
    {
      "name": "_month_colour",
      "value": "black"
    },
    {
      "name": "_weekend_colour",
      "value": "#E3E3E3"
    },
    {
      "name": "_weekday_colour",
      "value": "#E3E3E3"
    },
    {
      "name": "_task_colour",
      "value": "#35558A"
    },
    {
      "name": "_text_colour",
      "value": "white"
    }
  ],
  "vconcat": [
    {
      "name": "MONTH_TITLE",
      "width": 180,
      "height": 50,
      "transform": [
        {
          "joinaggregate": [
            {
              "op": "min",
              "field": "__row__",
              "as": "_min_row_number"
            }
          ]
        },
        {
          "filter": "datum['__row__'] == datum['_min_row_number']"
        }
      ],
      "mark": {
        "type": "text",
        "color": {
          "expr": "_month_colour"
        },
        "align": "left",
        "fontSize": 24,
        "fontWeight": "bold",
        "x": 0,
        "y": 40
      },
      "encoding": {
        "text": {
          "field": "_month_name",
          "type": "nominal"
        }
      }
    },
    {
      "name": "CALENDAR",
      "spacing": 2,
      "facet": {
        "column": {
          "field": "_day_label",
          "sort": {
            "field": "_day",
            "type": "quantitative",
            "order": "ascending"
          },
          "header": {
            "lineBreak": "|",
            "labelLineHeight": 16,
            "labelAnchor": "start",
            "labelExpr": "[slice(datum.value, 0, length(datum.value)-3), slice(datum.value, -2, 100)]",
            "labelFontSize": 12,
            "title": false
          }
        },
        "row": {
          "field": "_hour_label",
          "sort": {
            "field": "_hour",
            "type": "quantitative",
            "order": "ascending"
          },
          "header": {
            "labelAngle": 0,
            "labelAlign": "left",
            "labelExpr": "slice(datum.value, 3, 100)",
            "labelFontSize": 12,
            "title": false
          }
        }
      },
      "spec": {
        "layer": [
          {
            "name": "BACKGROUND",
            "width": 160,
            "height": 48,
            "mark": {"type": "rect"},
            "encoding": {
              "color": {
                "condition": [
                  {
                    "test": {
                      "field": "_day_of_week",
                      "oneOf": [0, 6]
                    },
                    "value": {
                      "expr": "_weekend_colour"
                    }
                  }
                ],
                "value": {
                  "expr": "_weekday_colour"
                }
              }
            }
          },
          {
            "name": "FOREGROUND",
            "width": 120,
            "height": 48,
            "transform": [
              {
                "filter": {
                  "field": "Task ID Measure",
                  "gt": 0
                }
              },
              {
                "calculate": "( datum['Task End DateTime'] - datum['Task Start DateTime'] ) / (60 * 60 * 1000 )",
                "as": "_duration_in_hours"
              }
            ],
            "mark": {
              "type": "rect",
              "color": {
                "expr": "_task_colour"
              },
              "stroke": "white"
            },
            "encoding": {
              "y": {
                "datum": 100,
                "type": "quantitative",
                "scale": {
                  "domain": [0, 100]
                },
                "axis": null
              },
              "y2": {"datum": { "expr": "datum['_duration_in_hours'] == 0.25 ? 75 : datum['_duration_in_hours'] == 0.50 ? 50: datum['_duration_in_hours'] == 0.75 ? 25 : 0" }}
            }
          },
          {
            "name": "FOREGROUND_TEXT",
            "width": 180,
            "height": 50,
            "transform": [
              {
                "filter": {
                  "field": "Task ID Measure",
                  "gt": 0
                }
              },
              {
                "calculate": "timeFormat(datum['Task Start DateTime'], '%-I:%M %p')",
                "as": "_start_hour_name"
              },
              {
                "calculate": "timeFormat(datum['Task End DateTime'], '%-I:%M %p')",
                "as": "_end_hour_name"
              },
              {
                "calculate": "datum['_start_hour_name'] + '-' +datum['_end_hour_name'] + '|' + datum['Task Notes Measure']",
                "as": "_multiline_task_label"
              },
              {
                "calculate": "datum['Task Notes Measure']",
                "as": "_task_label"
              }
            ],
            "mark": {
              "type": "text",
              "align": "left",
              "lineBreak": "|",
              "xOffset": -78,
              "yOffset": -17,
              "limit": 160,
              "color": {
                "expr": "_text_colour"
              }
            },
            "encoding": {
              "text": {
                "field": "_task_label"
              }
            }
          }
        ]
      }
    }
  ]
}

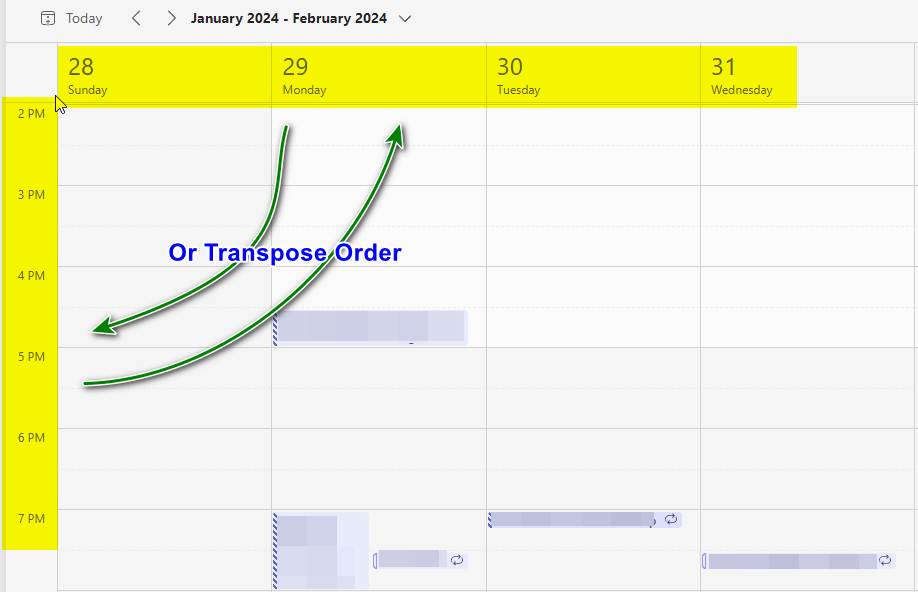
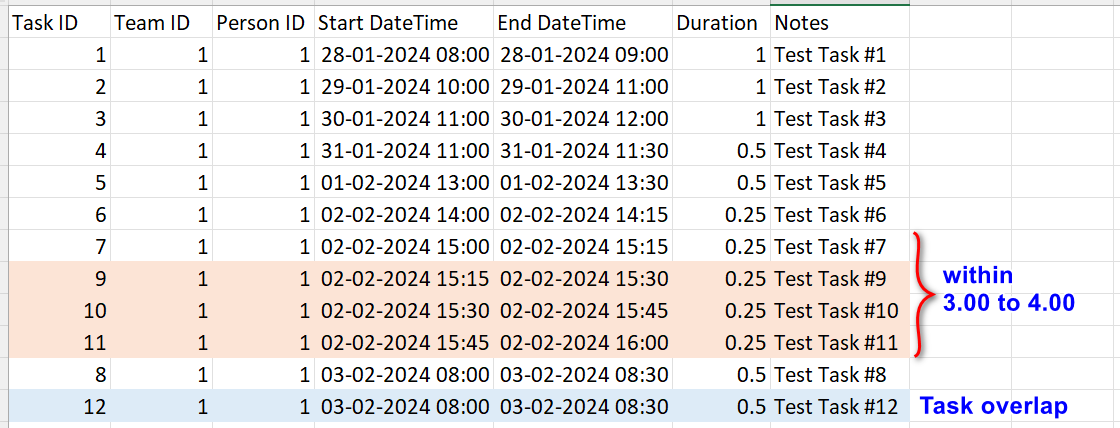
This is still rough, and further development would be warranted (for example, it doesn’t properly handle situations where there are multiple events in a single 1-hour interval), but should be a useful start.

Hope it helps.
Greg
eDNA Forum - Deneb Calendar - V2.pbix (1.5 MB)
Tasks.xlsx (9.5 KB)

4 Likes

Hi @Greg

I am writing to express my sincere gratitude for the exceptional development work and unwavering support you have provided.

I am looking into the solution, trying to learn.

Once again, thank you for your exceptional work and unwavering support.

Best Regards
Pijush

2 Likes

Hi @Greg

I am looking to modify a little to reflect if, within one hour, there are multiple tasks. Is it possible to show it in a single cell? There are many 15mins tasks available in the data.

Also if same time have an overlap task, how to handle (The chances are very low, but may be an overlap task). Not important but better to have functionality.

DatesWithTimes =
GENERATESERIES (DATE (2024, 01, 01), DATE (2024, 02, 29), 1/24)
If I update the measure and use 96 in place of 24, it will break the cell for 15-minute intervals.

Could you please guide me to achieve the above point?

Your support is highly required.

Thanks and Regards
Pijush

Hi @PijushRoy.

Please do not post to solved threads. Many forum members do not review solved threads, so it is in both the forum members’ and your best interest to create a new thread for each new question. (You can link to a solved thread if it’s pertinent to your new issue.)

@EnterpriseDNA, please split this thread into it’s own thread starting with the above post.

Regardless, not off the top of my head … this was one of the reasons why I asked for complete requirements, and, as none were provided, I started with a solution based on 1-hour intervals. If you facet by 1/4 hour you could do it, but it would make the visual 4x as busy. I’ll think on it a bit and see if I can think of anything.

Greg

1 Like