I have been working the latest days with a new logic that finally has worked, but also increased the model size by 50% ¡!
I know there is a better way to do it, but it requires a complex dax formula that I do not kow how to handle. As I have learnt, I have divided everything in sequential steps.
Context: We have defined different customer segments, so depending what products the customer chooses, the order is assignated to one segment or another. We have segments such us ‘Prefer rice’ or ‘Prefer chicken’, so we can understand and develop each customer segment separately.
The fact table ‘Sales table’ has one row for each order line.
Order ID
Qty
Product
Total Order Line
Total Order
x
1
Bread
1€
49,26€
x
1,3
Rice
13,26€
49,26€
x
1
Food product
11,00€
49,26€
x
2
Food product
24,00€
49,26€
First Step. I have created a virtual table called ‘Orders summarized and ranked’ that summarize each order by the segment related. I’ve also created a new column that ranks the segment by its sales importance.
Order ID
Segment
Weight
Rank
x
Bread
2,03%
3
x
Rice
26,91%
2
x
Food
71,05%
1
Second Step. I have created a virtual table ‘Orders with Top 1 segment‘ that captures from the previous table the Order ID and the segment in the number 1 position
Order ID
Segment
x
Food
Third Step. Finally I have created a new column in Sales Table with the Segment ID. Sales DNA Forum.pbix (1.8 MB) Segment id = related(‘Orders with Top 1 segment’[Segmento])
I know I should have used TOPN instead of Rankx but it didn’t work. Besides, the main problem is the model size, I guess the virtual tables are not so ‘virtual’
I know it can be done through a dax formula so the logic is only applied for the filter context (dates and stores) and not for the whole sales table.
The issue here is that you’re not actually using virtual tables – you are using physical tables created via DAX expressions. Virtual tables exist only within the context of measures. It might sound like semantic hairsplitting, but the implications for size and potentially performance are significant.
If you want to reduce the file size, you will need to create truly virtual tables using variables within a measure. Here’s a recent example of extensive virtual table manipulation I did that used a similar stepwise approach to the solution that you used above for your DAX expression tables. (Note: the example is somewhat of a nonsense approach, since DAX was not the proper tool in this case but is a good illustration I think of the power of manipulating virtual tables through variables).
1st Segment =
VAR OrdersSummarized = // New virtual table group by orders & segments, calculating the weight.
SUMMARIZECOLUMNS (
‘Sales Table’[id_Unica], // Order id
‘Products’[Segmento],
“Weight”, [% Sales line over order])
VAR OrdersSummarizedRanked = // I creeate a new table with a new column that ranks each segment, so I can choose the first later on.
ADDCOLUMNS (
OrdersSummarized,
“Rank”, rankx(
FILTER(
OrdersSummarized,
[id_Unica]=EARLIER([id_Unica])),
[Weight],Dense))
VAR Top1Segment =
CALCULATE(
[Max Segment], // a measure that gives me the segment id for each order in context
FILTER(OrdersSummarizedRanked, [Rank] = 1)) // I am expecting to get just the 1st ranked segment for each order
Well, it finally worked … There was a problem with Summarizecolumns… Still too much to learn. There it goes the code:
1st segment w/ Top N =
VAR OrdersSummarized = // New virtual table group by orders & segments, calculating the weight.
SUMMARIZE(
‘Sales Table’,
‘Sales Table’[id_Unica], // Order id
‘Products’[Segmento],
“Weight”, [% Sales line over order])
VAR OrdersSummarizedRanked = // I creeate a new table with a new column that ranks each segment, so I can choose the first later on.
ADDCOLUMNS (
        OrdersSummarized ,
        "Rank", rankx(
                 FILTER(
                    OrdersSummarized ,
                    [id_Unica]=EARLIER([id_Unica])),
                    [Weight],,,Dense))
VAR Result =
    CALCULATE([Min Segmento],FILTER(OrdersSummarizedRanked,[Rank]=1))
Nice work – you’re 98% of the way there. Just two changes needed, one structural and one recommended notational.
Structural: - don’t use SUMMARIZE to add measure based virtual columns to a virtual table. This can result in irregular results. Instead, use SUMMARIZE nested inside of ADDCOLUMNS (or alternatively SUMMARIZECOLUMNS). Here’s how your first variable will change:
VAR OrdersSummarized =
 ADDCOLUMNS(
 	SUMMARIZE(
 		‘Sales Table’,
 		‘Sales Table’[id_Unica], // Order id
 		‘Products’[Segmento]
 	),
 	“@Weight”, [% Sales line over order]
 )
if you want to understand the full rationale behind wrapping SUMMARIZE in ADDCOLUMNS, I’d refer you to this article:
Notational – you will note above when I added the measure column to the virtual table, I put an “@” in front of weight. This is a best practice to distinguish calling a virtual column from a measure, suggested by Ferrari in this article, which as the expert team we’ve generally adopted in our solutions on the forum.
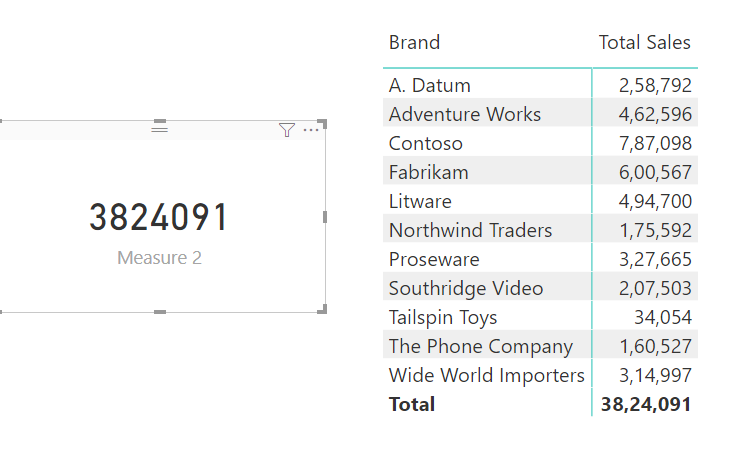
That’s because SUMMARIZECOLUMN can’t work in a filter context modified by context transition. PBI generates queries using SUMMARIZECOLUMN and outer SUMMARIZECOLUMN will modify the filter context for the inner SUMMARIZECOLUMN , here is an example.
// DAX Query
EVALUATE
SUMMARIZECOLUMNS (
    -- This is what causes the problem, it is a known issue and I don't think microsoft has any plans on resolving this
    ROLLUPADDISSUBTOTAL (
        'Products'[Brand],
        "IsGrandTotalRowTotal"
    ),-- This populates the grand totals
    "Total_Sales", 'SalesMeasures'[Total Sales]
)
.
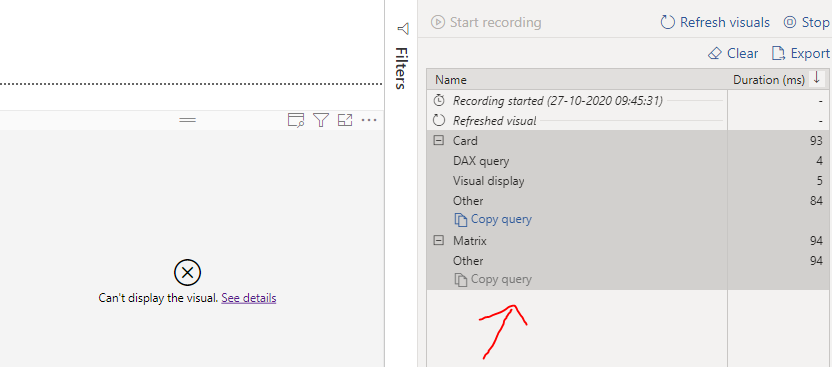
If I include the measure which uses SUMMARIZECOLUMNS in the matrix, it will break
Thanks both @BrianJ, @AntrikshSharma I really aprreciate it, I follow your lessons and best practices !! Keep fighting with the model, I will let you know if i get stuck.