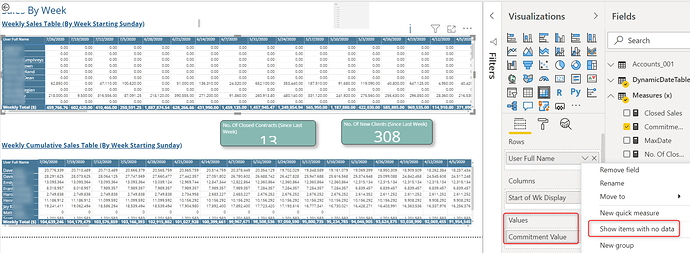
- Our source Sales data has a numeric field called Total Commitment Amount.
- We converted that into a Measure named Commitment Value as follows:
Commitment Value =
IF(
CALCULATE( SUM( Potentials_001 [Total Commitment Amount]))=BLANK(),
0,
CALCULATE(SUM(Potentials_001[Total Commitment Amount]))
) - When I drop the new Commitment Value Measure into my Table visual, suddenly ALL the Index column values display, even those with no real data, even though I do not have that box check in my Rows setup (see screenshot)
Is there something wrong with the way I’ve structured my Measure?
In the screenshot I am attaching with this, the bottom table is the way I want my records to display, but the table at top of the screenshot is my reason for creating this topic.
Inside your IF statement you are checking if the result is BLANK and if it is you are returning a zero. That is the cause of this behavior… maybe you can add an additional condition to your IF statement before returning the zero, for example check if the total for all selected dates is greater than 0 or whatever makes sense in this specific case, you’re a better judge on that.
Hello @kjssdca,
Thank You for posting your query onto the Forum.
The condition which has been specified in the first part of the formula i.e. "IF( CALCULATE( SUM( Potentials_001 [Total Commitment Amount] ) ) = BLANK() , 0 " is causing the result to be appeared as 0 when there’s no value against those “User Full Name”. Since the interpretation of the formula that you’ve written is as follows -
**If there’s no value against the particular “User Full Name” show it as 0 instead of blank otherwise show the value as it is.
And therefore, this has nothing to do with the “Show Items With No Data” options.
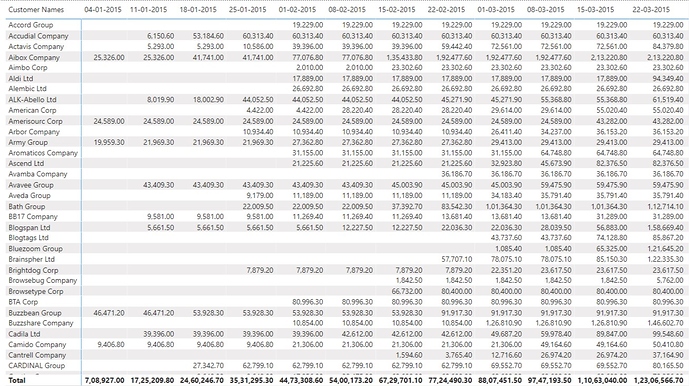
Secondly, the result that you’re trying to achieve is the “Cumulative Weekly Total” in the 2nd table of the screenshot. Below are the screenshots provided for the reference where I’ve calculated the results showing 2 options -
Option 1: Cumulative Total over a period of time
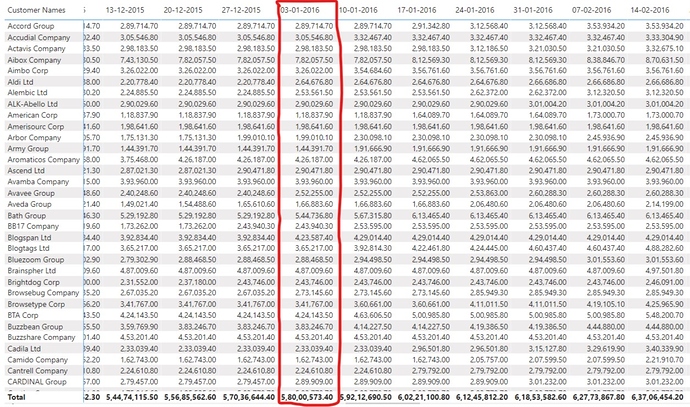
Now, if scroll till the start of the year 2016 you’ll find that total will keep on accumulating the previous figures.
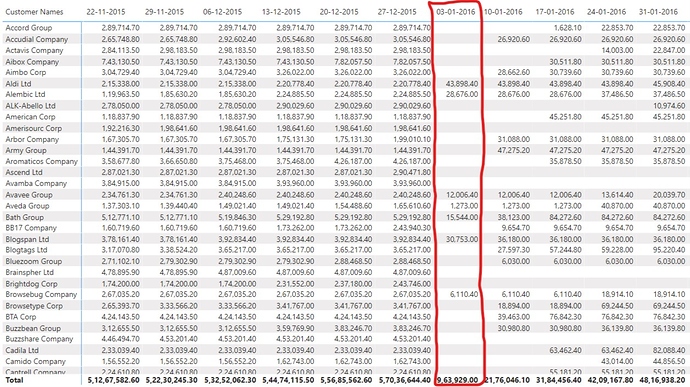
Option 2: Cumulative Totals Year-on-Year Basis
If you observe the 2nd solution, the cumulative total restarts from 0 upon starting of the each year.
I’m also attaching the working of the PBIX file for the reference so that you can refer the formulas for calculating the cumulative totals.
Hoping you find this useful and helps you to achieve the desired results that you’re looking for. 
Thanks and Warm Regards,
Harsh
Weekly Cumulative Total.pbix (662.4 KB)
Hi @kjssdca, a response on this post has been tagged as “Solution”. If you have a follow question or concern related to this topic, please remove the Solution tag first by clicking the three dots beside Reply and then untick the check box. Also, we’ve recently launched the Enterprise DNA Forum User Experience Survey, please feel free to answer it and give your insights on how we can further improve the Support forum. Thanks!


