Using a Matrix with customised totals

Hi,
I am hoping that you can provide me with some advice on a matrix. Below is a snapshot from an SSRS report that I am converting to Power BI.

image

Criteria: Forecast End Date < Today’s date (green rows)

  1. Value @ Line 2 - a count for each Project Manager where their projects met the criteria [Forecast End Date]<Today’s date (23/06/2020)

  2. Value @ Line 1 - SUM of values @ Line 2 and Line 10. For all project managers reporting to a program manger, sum the number where projects met the criteria [Forecast End Date]<Today’s date

Question: How do I then represent the values @ Line 1,2 & 10 using a matrix, taking into consideration the dates for the Forecast End Date are to be displayed as well?

Any advice or suggestions would be great. Thanks.

Hello @Kazza,

Thank you for posting the query onto the Forum.

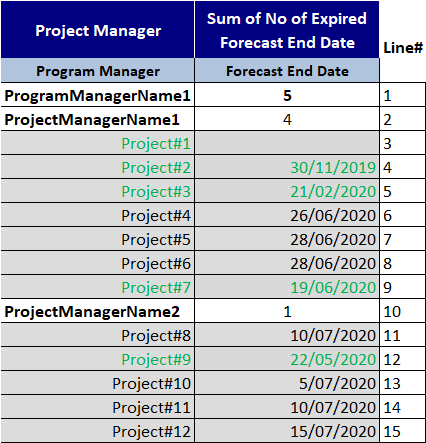
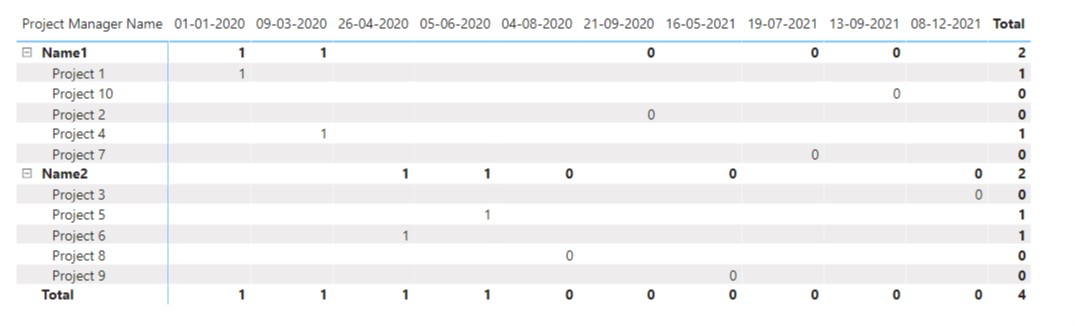
Since the under “Row Dimension” you have Project Manager Name as well as Project Name and under the “Column Dimension” you have Forecast End Date in Power BI if we try to drag the fields in this manner the Matrix would not show the result as expected. Below is the screenshot attached for the reference.

And if we try to drag all the fields under the “Row Dimension” then “Drill Down” or "Expand the level of Hierarchy" then the result will be shown as provided below for the reference.

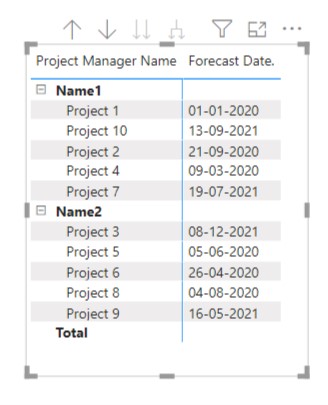
So in order to have the Project Manager Name as well as Project Name and under the “Row Dimension” and Forecast End Date under the “Column Dimension”. Now, we’ll be required to write a simple measure so that we can drag Forecast End Date under the “Values Dimension” to have the expected result . The measure will be as follows -

Forecast Date. = 
IF( SELECTEDVALUE( Data[Forecast End Date] ) < TODAY() , 
    SELECTEDVALUE( Data[Forecast End Date] ) , 
    SELECTEDVALUE( Data[Forecast End Date] ) )

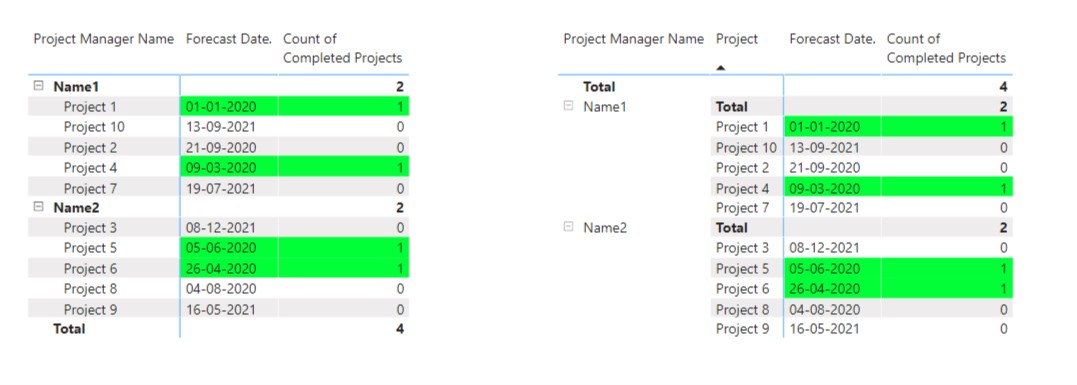
Now, we can have the result as expected as shown below -

Image 3 - Customized Totals

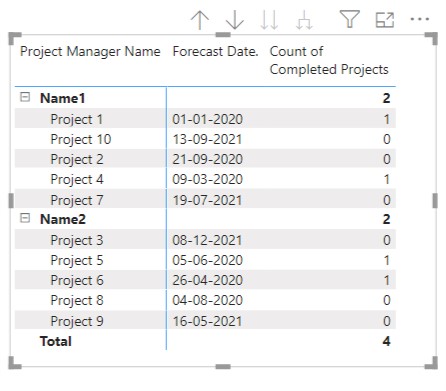
Now to calculate the “Count of Completed Projects” we need to write 2 measures as follows -

Forecast Date < Today's Date = 
IF( [Forecast Date.] < TODAY() , 
    1 , 
    0 )

And other measure will be -

Count of Completed Projects = 
IF( [Forecast Date < Today's Date] = 1 , 
    SUMX( Data , [Forecast Date < Today's Date] ) , 
        0 )

After writing this 2 measures you can have desired result as shown below -

Image 3 - Customized Totals

I’m also attaching the PBIX file of my working for the reference.

Hoping you find this useful and helps you to achieve the best desired analysis.

Thanks & Warm Regards,
Harsh

Using Matrix with Customized Totals.pbix (121.5 KB)

2 Likes

Thank you so much for your solution it is fantastic and will go a long way to helping me!!

However, as shown in my image, is it possible to get the final total (in your example it is the value 2) showing above the date field rather than in a separate column where the 1’s and 0’s are also showing? I simply want the final total for each ‘Name’ to be sitting above the date and I do not want to see the individual 1’s and 0’s where the criteria has been met.
Perhaps this is not possible in Power BI?

Hello @Kazza,

You’re welcome. :slightly_smiling_face:

Glad I was able to help you.

The thing is “Forecast Date.” measure which we have created on that we’ve applied “Date” format. And therefore, a separate measure had to be created and therefore, had to use an additional column to show the final result.

Finally, as mentioned in the above image the rows were also highlighted in green color and that can be applied using “Conditional Formatting”. I’m attaching the screenshot as well as the PBIX file.

In the above image, you might observe that “Conditional Formatting” is not applied on “Project Manager Name” and “Project Name” and this is due to we’ve only 2 options available and those were “Forecast Date.” and “Count of Completed Projects”. Below is the screenshot attached for the reference.

Image 6 - Customized Totals

Hoping this is useful and helps you in the analysis.

Thanks & Warm Regards,
Harsh

Using Matrix with Customized Totals.pbix (122.5 KB)

1 Like