Hi,
I would love some help on creating a customised total for a field that is based on an expression?
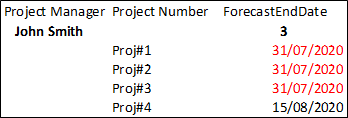
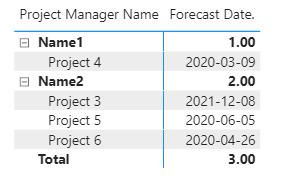
I wish to calculate the sum by project manager of the number of times a project has past it’s forecast end date based on Today() as the reference date - 07/08/2020.
Is it possible to put this count as a total in the Forecast End Date field as shown below?
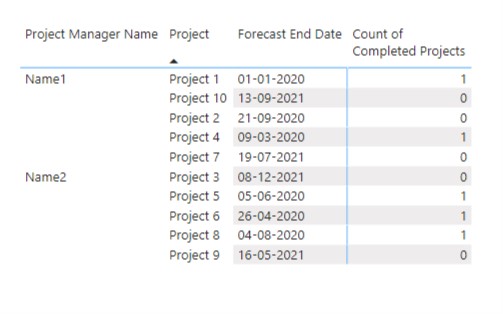
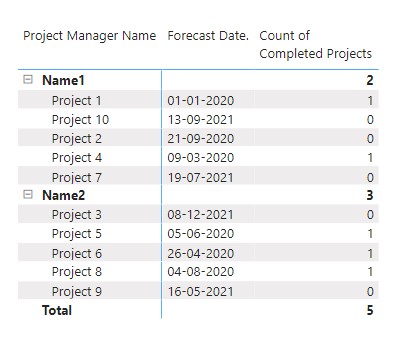
I’m afraid to say but this might not be possible because your “ForecastEndDate” is in the form of “Date” format and this is being dragged under the Rows category of the Matrix. Now, if you create a measure and drag it under the Values category it will add up just another column to show the “Totals” figure instead of showing it under the “ForecastEndDate”. Below is the screenshot provided for the reference -
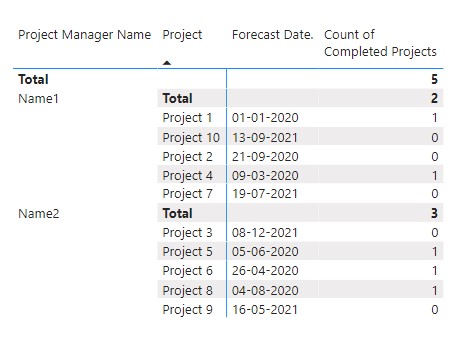
And I guess, I’d provided this similar type of solution on the Forum on 30th June’2020 where I’d mentioned the same issue why this was not possible and how alternatively you can show this in your Matrix visual. Below are the screenshot provided for the reference.
I’m providing a link below of the solution which I’d provided for the reference where it contains the reasons why this was not possible.
Also just couple of days back Adam Saxton from Guy in a Cube created a video where he has addressed similar sort of issue where one wants to show two different contexts within the same column of the visual. This video is very much applicable in this scenario as well.
Lastly, I’m providing the working of my PBIX file which I’d attached in my previous post.
Thank you for your reply. I thought perhaps I hadn’t explained it properly hence I explained it a different way. I need to show the totals hence, I think I’ll need to create another visualisation to show the totals. Thanks again for taking the time.