Unexpected outcome from DAX measure for Standard Deviation

Hi,

A previous message helped me to develop a proper DAX measure to calculate a weighted average. Now I would like to add a measure for Standard Deviation. But my DAX measure continuously returns 0 as outcome:

Standard_Dev LOW Season =
VAR _Num = SUMX(
FILTER(‘Price plans’,
‘Price plans’[Season] = “Low”
),
(‘Price plans’[Price] - [Weighted price LOW Season]) ^ 2 * RELATED(Aircrafts[Capacity]))
VAR _Denom = SUMX(
FILTER(‘Price plans’,
‘Price plans’[Season] = “Low”
),
RELATED(Aircrafts[Capacity]))
VAR _Result = DIVIDE(_Num, _Denom)
RETURN _Result

Can anyone explain how to improve this measure?

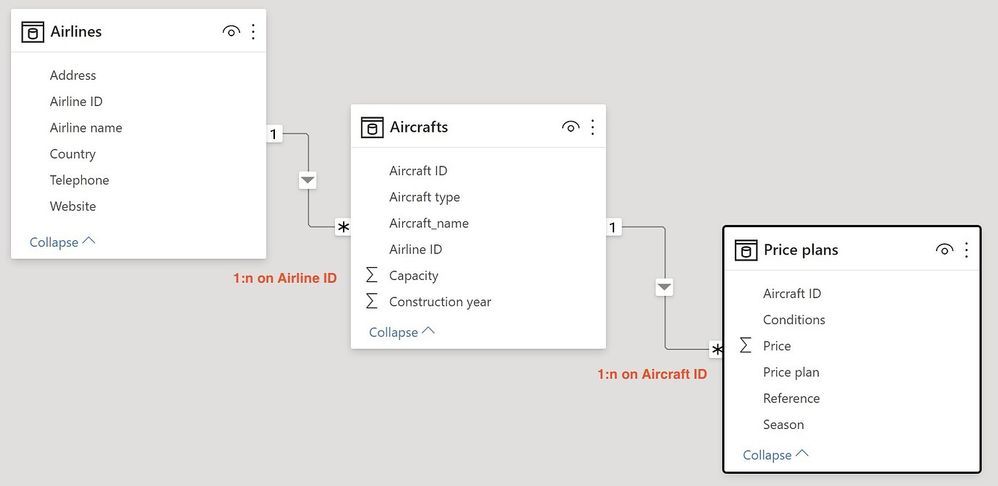
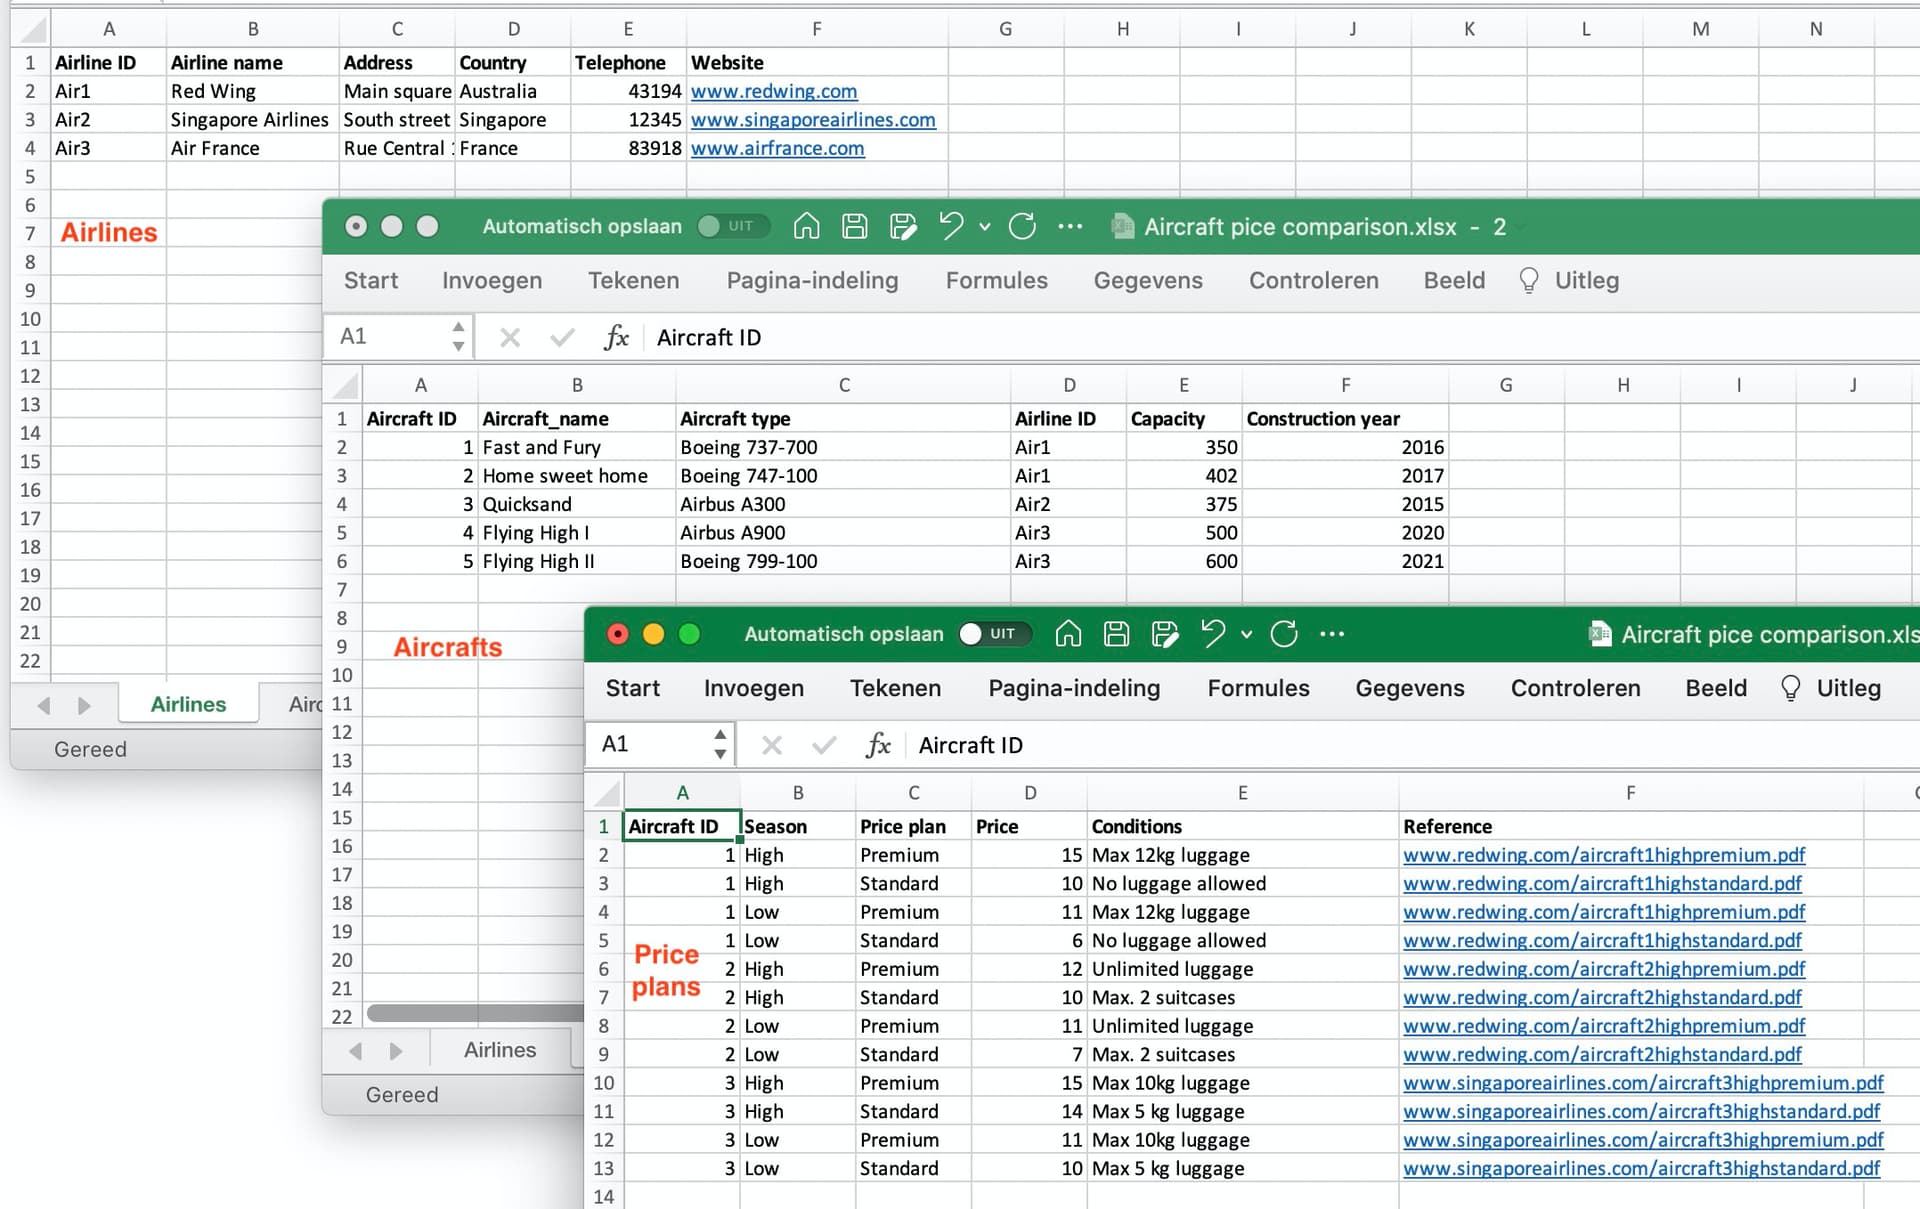
The datamodel is about airlines, where each airline has one or more aircrafts. And each aircraft has a Standard and a Premium price scheme for both low and high season.

This is what the datamodel looks like:

And the contents of the tables:

The DAX measure to calculate the weighted average proce for the LOW season price plans is:

Weighted price LOW Season =
VAR _Num = SUMX(
FILTER(‘Price plans’,
‘Price plans’[Season] = “Low”
),
‘Price plans’[Price] * RELATED(Aircrafts[Capacity]))
VAR _Denom = SUMX(
FILTER(‘Price plans’,
‘Price plans’[Season] = “Low”
),
RELATED(Aircrafts[Capacity]))
VAR _Result = DIVIDE(_Num, _Denom)
RETURN

Hopefully someone can show whats wrong with the way I calculate the Standard Deviation.

I also attached the PBIX-file woth the data model and DAX measures I developed so far: https://1drv.ms/u/s!AmD4aHeJ1Mpgim4WRTVOGDY73feC?e=IO4VLB

Hi @Sebastiaan ,

PBIX attached:
Airline price plan 5.pbix (44.4 KB)

How exactly do you want to calculate the STDEV ?
Why would you not use the standard formula on the price table:

DS Standard_Dev = STDEVX.P('Price plans', 'Price plans'[Price])

Generally the calculation explained:
–Step 1: Find the mean
–Step 2: Find each score’s deviation from the mean
–Step 3: Square each deviation from the mean
–Step 4: Find the sum of squares
–Step 5: Find the variance, divide the sum of the squares by N ( total population available capacity) or N-1 by a sample
–Step 6: Find the square root of the variance ===> standard deviation

I calculated Price - Weighted Average price and Price - Average Price in Excel, the differences are nihil.
See attached Excel.
StDev.xlsx (10.8 KB)

I tried to build the above 6 steps in Power BI, but calculating differences (like price - WA price) in combination with Standard Deviation did not work, it gives null like you have experienced already.

I hope I gave you some further ideas.

Kind regards, Jan van der Wind

1 Like

Thank you for the solution @deltaselect :slight_smile:

Hello Sebastian, did the response above help solve your query? It’s been a while since we got a response from you.

In case there won’t be any activity on it in the next few days, we’ll be tagging this post as Solved.

Hi @Sebastiaan, due to inactivity, a response on this post has been tagged as “Solution”. If you have any concern related to this topic, you can create a new thread.