I joined the Enterprise DNA Forum because i was inspired by the vizualization shared in the EnterpriseDNA Challenges. One special report that inspired me to look at charticulator was developed by @MudassirAli.
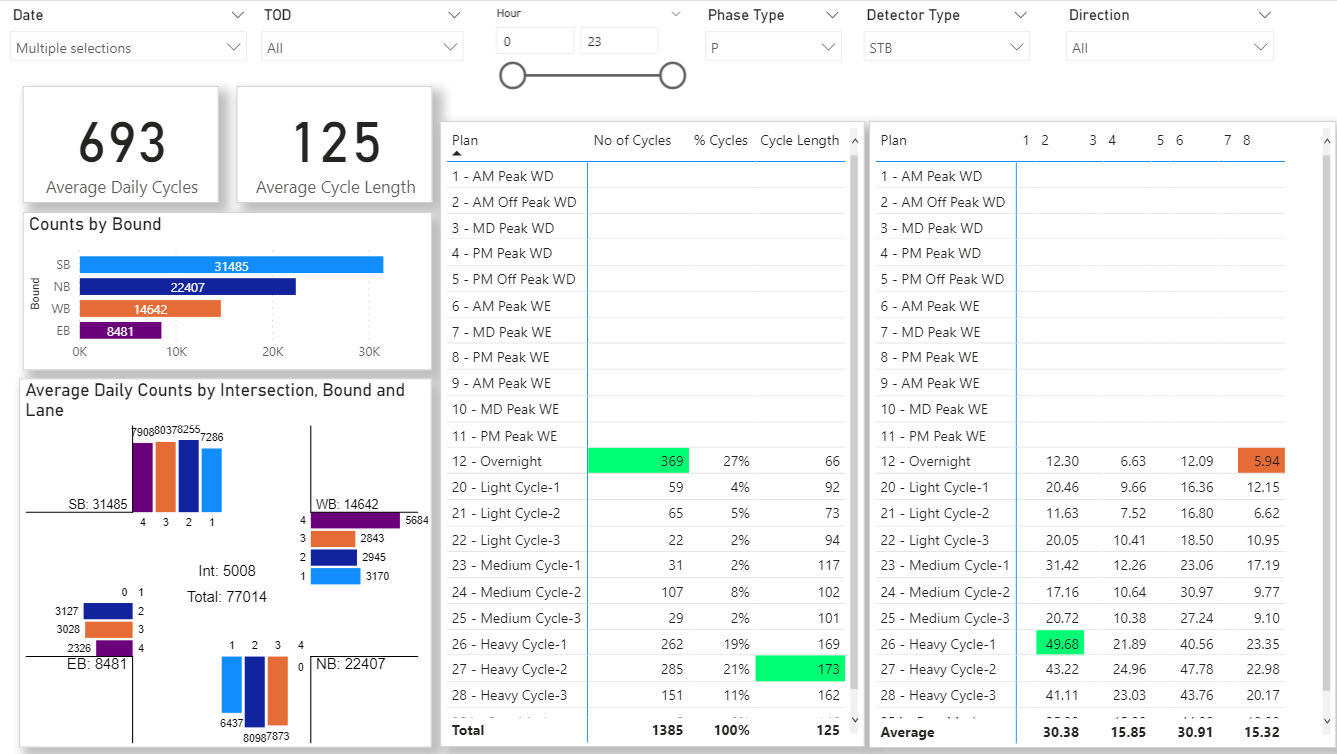
As a result, i started learning about charticulator. Using the tool, i have been able to create an intersection timing and counts analysis report that looks like this
Had it not been the inspiration from @MudassirAli, i would have never though about creating an interesction report such as this.
I am really greatful to @sam.mckay, @BrianJ and their team, and @MudassirAli and everyone who share their work. Without you guys, i wouldnt have been where i am today in my organization.
I will continue to visit this site, view your work, gain inspiration and share my own work with you guys,.
Thanks so much for your post. It’s wonderful hearing people’s stories as to how eDNA and this fantastic community are positively impacting their development and careers. I would really encourage you (and everyone else…) to actively participate in this community, through the forum, the Data Challenges, Problem of the Week, and other initiatives. It’s absolutely the best way to learn and develop your skills, and also to give us the opportunity to learn from you.
I completely agree that @MudassirAli’s reports are an inspiration, and it’s awesome to see how they’ve led you to develop really interesting visuals as well.
Keep up the great work and we look forward to seeing more from you in the future!
@atifhafeez I really appreciate your post but what I appreciate more is the fact that you actually built something unique on your own. Kudos to you for trying new things. It’s so good to see people benefitting from the work done by EDNA community and getting successful in their careers.
Keep up the great work and the spirits high!
P. S. I am really interested to know how you created that chart. Are these separate visuals or one nested visual?
It a single visual with nested charts (plot segments as you would say in charticulator. ). This visual represents one type of interection. There are around 3 or 4 more variations in our project. I plan on creating them as well.
Hi @atifhafeez, thank you for providing us a very good insight into group discussion in Power BI. We recently launched the Forum Survey, which enables us to review the members’ feedback and the improvement needed in the forum. We will greatly appreciate if you can answer the Enterprise DNA Forum User Experience Survey and rest assured that all your inputs will be well recognized.