For several days now and after watching many Enterprise DNA tutorials on segmentation and categorization, I regret to note that I need help developing the correct count after applying segmentation.
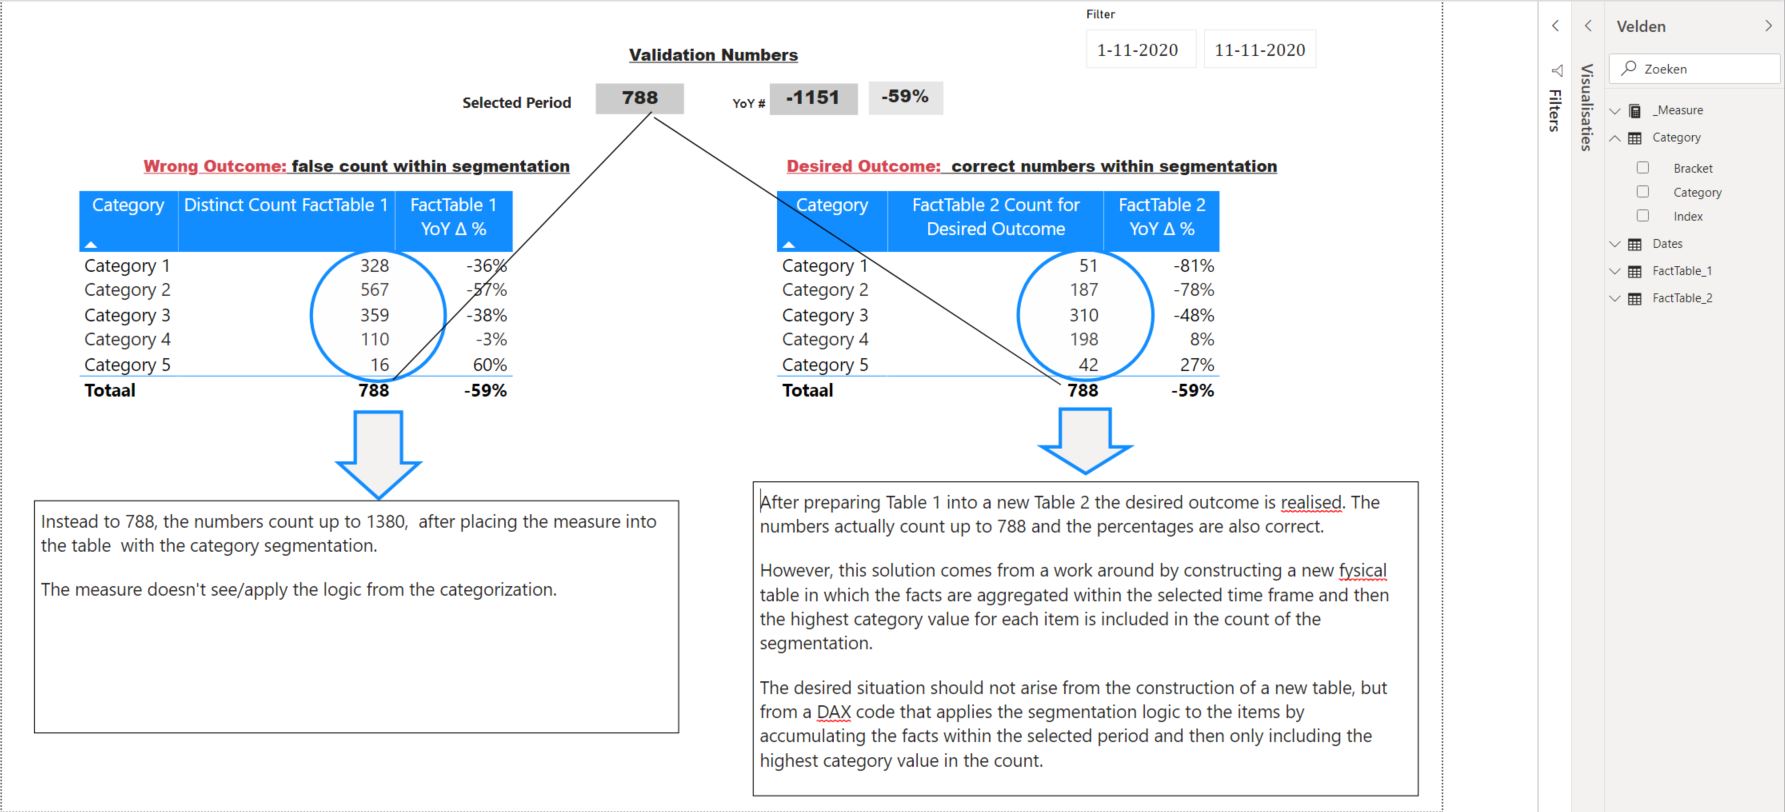
Instead to 788, the numbers count up to 1380, after placing the measure into the table 1 with the category segmentation. The measure doesn’t see/apply the logic from the categorization.
After preparing Table 1 into a new Table 2 the desired outcome is realised. The numbers actually count up to 788 and the percentages are also correct.
However, this solution comes from a work around by constructing a new fysical table in which the facts are aggregated within the selected time frame and then the highest category value for each item is included in the count of the segmentation.
The desired situation should come from a DAX code that applies the segmentation logic to the items by accumulating the facts within the selected period and then only including the highest category value in the count.
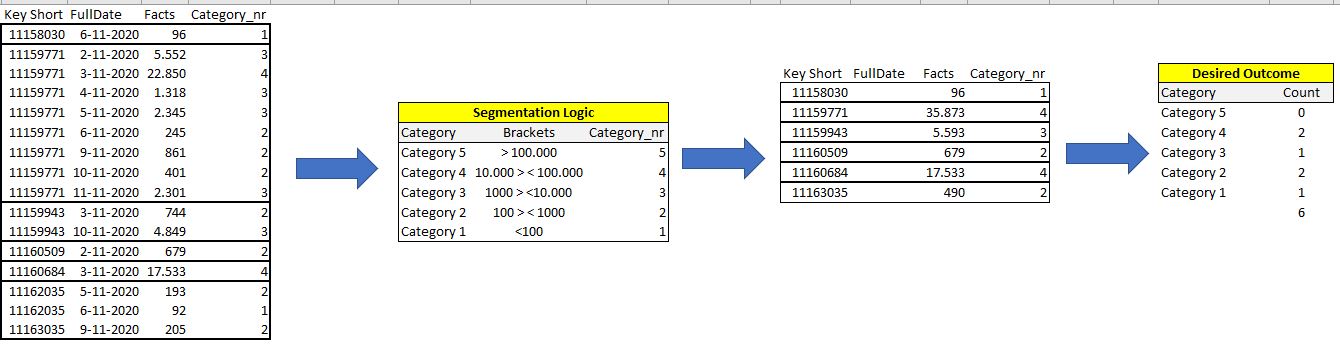
The screenshot below is a schematic representation of how the DAX Code should apply the segmentation logic which should lead to the desired outcome!!
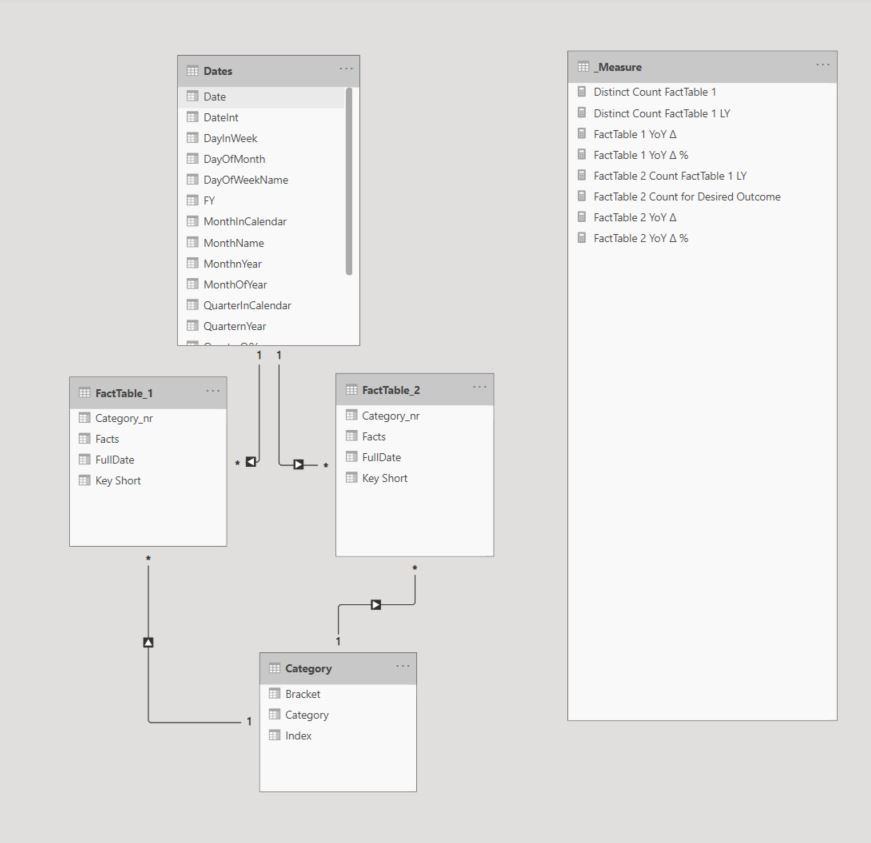
Also a screenshot of the Data Model as it is now drawn up, but I suspect that the Category Table that represents the logic should not be linked to the FactTables?
Hi @Mischa. Can you please attach your work-in-progress PBIX and an Excel mock-up of your desired outcome to help the forum members analyze your current state and visualize the issue? Also, if you include DAX in your post, please format it using the built-in formatter.
Greg
Thanks for posting your question @Mischa. To receive a resolution in a timely manner please make sure that you provide all the necessary details on this thread.
Here is a potential list of additional information to include in this thread; demo pbix file, images of the entire scenario you are dealing with, screenshot of the data model, details of how you want to visualize a result, and any other supporting links and details.
Including all of the above will likely enable a quick solution to your question.
Hello Greg, as you can see I have reformulated my question and provided all the attachments requested by you. Hopefully it is now more clear what the desired outcome should be.
To get the 1380 total you’re looking for in the first table, you just need to apply the “Fix Incorrect Totals” DAX pattern from eDNA Forum Fix Incorrect Totals
your [Dates] table was not marked as such; I marked the [Dates] table as a date table
a large majority of rows in the [FactTable_2] are blank (77%; 8990/11717); I’m unsure if this is affecting the results, but denotes a problem with the data; a review is warranted
Hi @Mischa, a response on this post has been tagged as “Solution”. If you have a follow question or concern related to this topic, please remove the Solution tag first by clicking the three dots beside Reply and then untick the check box. Also, we’ve recently launched the Enterprise DNA Forum User Experience Survey, please feel free to answer it and give your insights on how we can further improve the Support forum. Thanks!
Hi Greg, sorry say but the given solution yields a total count of 1380 and that is absolutely not the desired one as described in my excel document. I honestly do not know how to be any clearer in explaining the expected solution, so thank you for all the effort. Regards Mischa
Hi @Mischa. Sorry it didn’t work for you. Yes, there’s a disconnect … I thought your issue was you couldn’t get 1380. After looking solely at your Excel mockup, it seems your looking to segment the rolled-up values not the individual records themselves, and this I think is beyond the scope of the current pattern. My next thought might be to put the rolled-up values in a calculated table (if you don’t have too much data) after which the pattern can be applied.
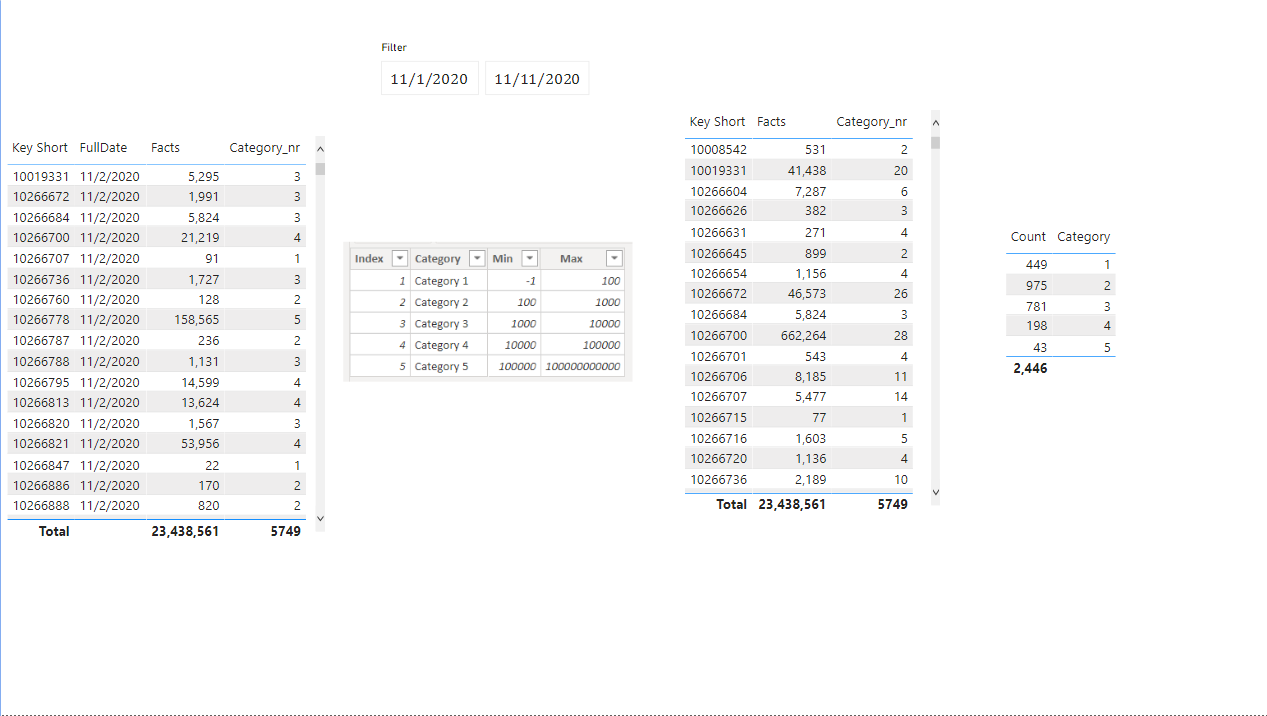
@Mischa It’s still confusing what you want to achieve with Dynamic segmentation. There are two tables in pbix file and both have different row sizes. However, according to the file Desired Outcome Schema, I have managed to make a dynamic segmentation
The category is based on the Sum of Facts and then each category is counted based on the segmentation. The measure to dynamically segment the categories is as follows:
Count =
VAR MinValue =
    MIN ( Category[Min] )
VAR MaxValue =
    MAX ( Category[Max] )
VAR Result =
    COUNTROWS (
        FILTER (
            FactTable_1,
            VAR FactValue = [Total Facts Value]
            RETURN
                FactValue > MinValue
                    && FactValue <= MaxValue
        )
    )
RETURN
    Result
Hi Greg, I think the way you describe it now seems correct to me, but first of all please forget about that FactTable_2, it was only included by creating it in excel and then adding it to the data model to come to a correct visuals, sorry for the confusion. I added a new PBI file with only FactTable_1 and also shortened the dataset considerably and cleaned it for null records.
The items [KeyShort] in FactTable 1 have multiple records as you can see. If I would add that up, you would get a total of 1380, but that is not the intention, as has become clear.
The [Facts] must therefore be added up per [KeyShort] and only then must the logic of the categories 1,2,3,4 or 5 be assigned to this summed value. DataModel DNA Enterprise.pbix (324.9 KB) The end result that this DAX measure should give is a distinct count of the KeyShort by category, but only after a summation of the [Facts] in FactTable_1 has taken place.
As far as I’m concerned, you do not have to provide the entire DAX code, although it would be useful, but also a reference to a pattern previously developed by DNA Enterprise, which first sums the facts, then applies the logic and then starts counting, within teh given time frame (Date Filter) , I would be satisfied with. Regards Mischa