I’m using Choropleth Map visual for more details refer this link and I have the requirement to drill down from US state → city. To do that, I need Topojson file for US cities. Can some one help me to provide the topojson file for US cities
Have you tried the census.gov website? They provide shapefiles as far as I can tell. It may become a huge dataset with all cities, so you need to test with a few shapes what it brings. Furthermore I recommend to simplify the shapes in mapshaper.org, this will reduce the number of points of the shape before converting to topojson and contribute to faster handling. You can use the Mapbox visual for visualisation of shapes and multiple layers as well.
If not available at census.org, you can try geofabrik.de, website is english, otherwise you may need GIS software to create your own shapes.
Hi, many shapes and boundaries, like for cities and postcodes may be available at a cost only. Also file size may be a problem even if you have the cities. Did you check catalog.data.gov, I have not tested it but 500 cities available for download.
Paul
In the meantime I have been digging further, a friend of mine is a US cartographer so I asked him and I am looking at David Eldersveld who has a collection of shapefiles on github, so story continues.
Any luck with this yet? I tried my GIS software, however cities will come up as points. Have started to learn QGIS, it allows to export shp files from an OSM map, so let’s see what it can do.
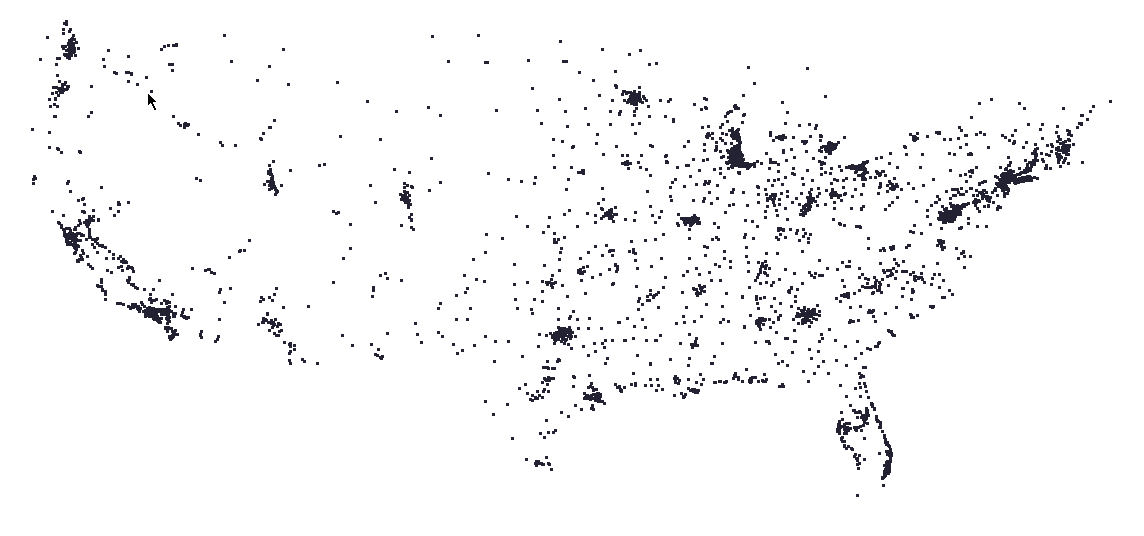
Hi, Chloropeth map shows shapes, like boundaries ie states, counties, postcodes etc, these are vectors built from multiple points. Your .json file holds a point layer, which cannot be handled by a chloropeth map. You can import this as a point layer in PBI.
Paul
Hi, Can you please tell me, what are the different Map visuals support Point layer in PBI. Due to some security reason, my origination disables ArcGIS & shape Map visuals. Can you please tell me, is their any other option to drilldown from state to city with boundaries for United States.
Hi,
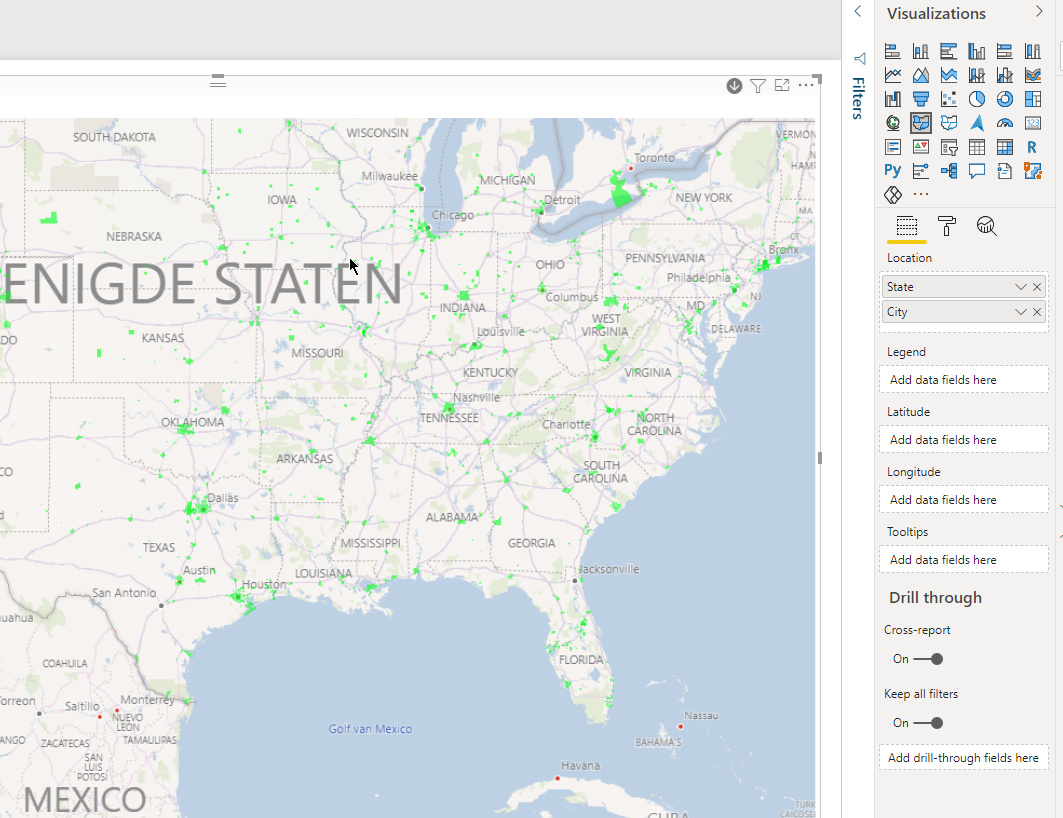
A map visual will, by default, assuming you have a latitude/longitude or a city, display a point layer.
Drilling down in the map visual is possible by creating a “geohierarchy” , state, city, etc.
Other custom visuals like Mapbox and Iconmap allow to create your own layers and show these. This month a Drill Down Map visual has been introduced by Zoomchart, it is a pro version at a cost, free trial.
Unfortunately R is not my field of experience.
My pleasure.
I am based in The Netherlands so probably not fully up to speed with US data availability. Using a GIS I can extract the shapefiles and convert myself. Github is the place to go normally or census.
Have you tried the filled map visual? If you enter the state and city in the location well, the map will render but it is very, very slow, hence my considerations about using city boundaries or even “worse” postcodes in a map visual.
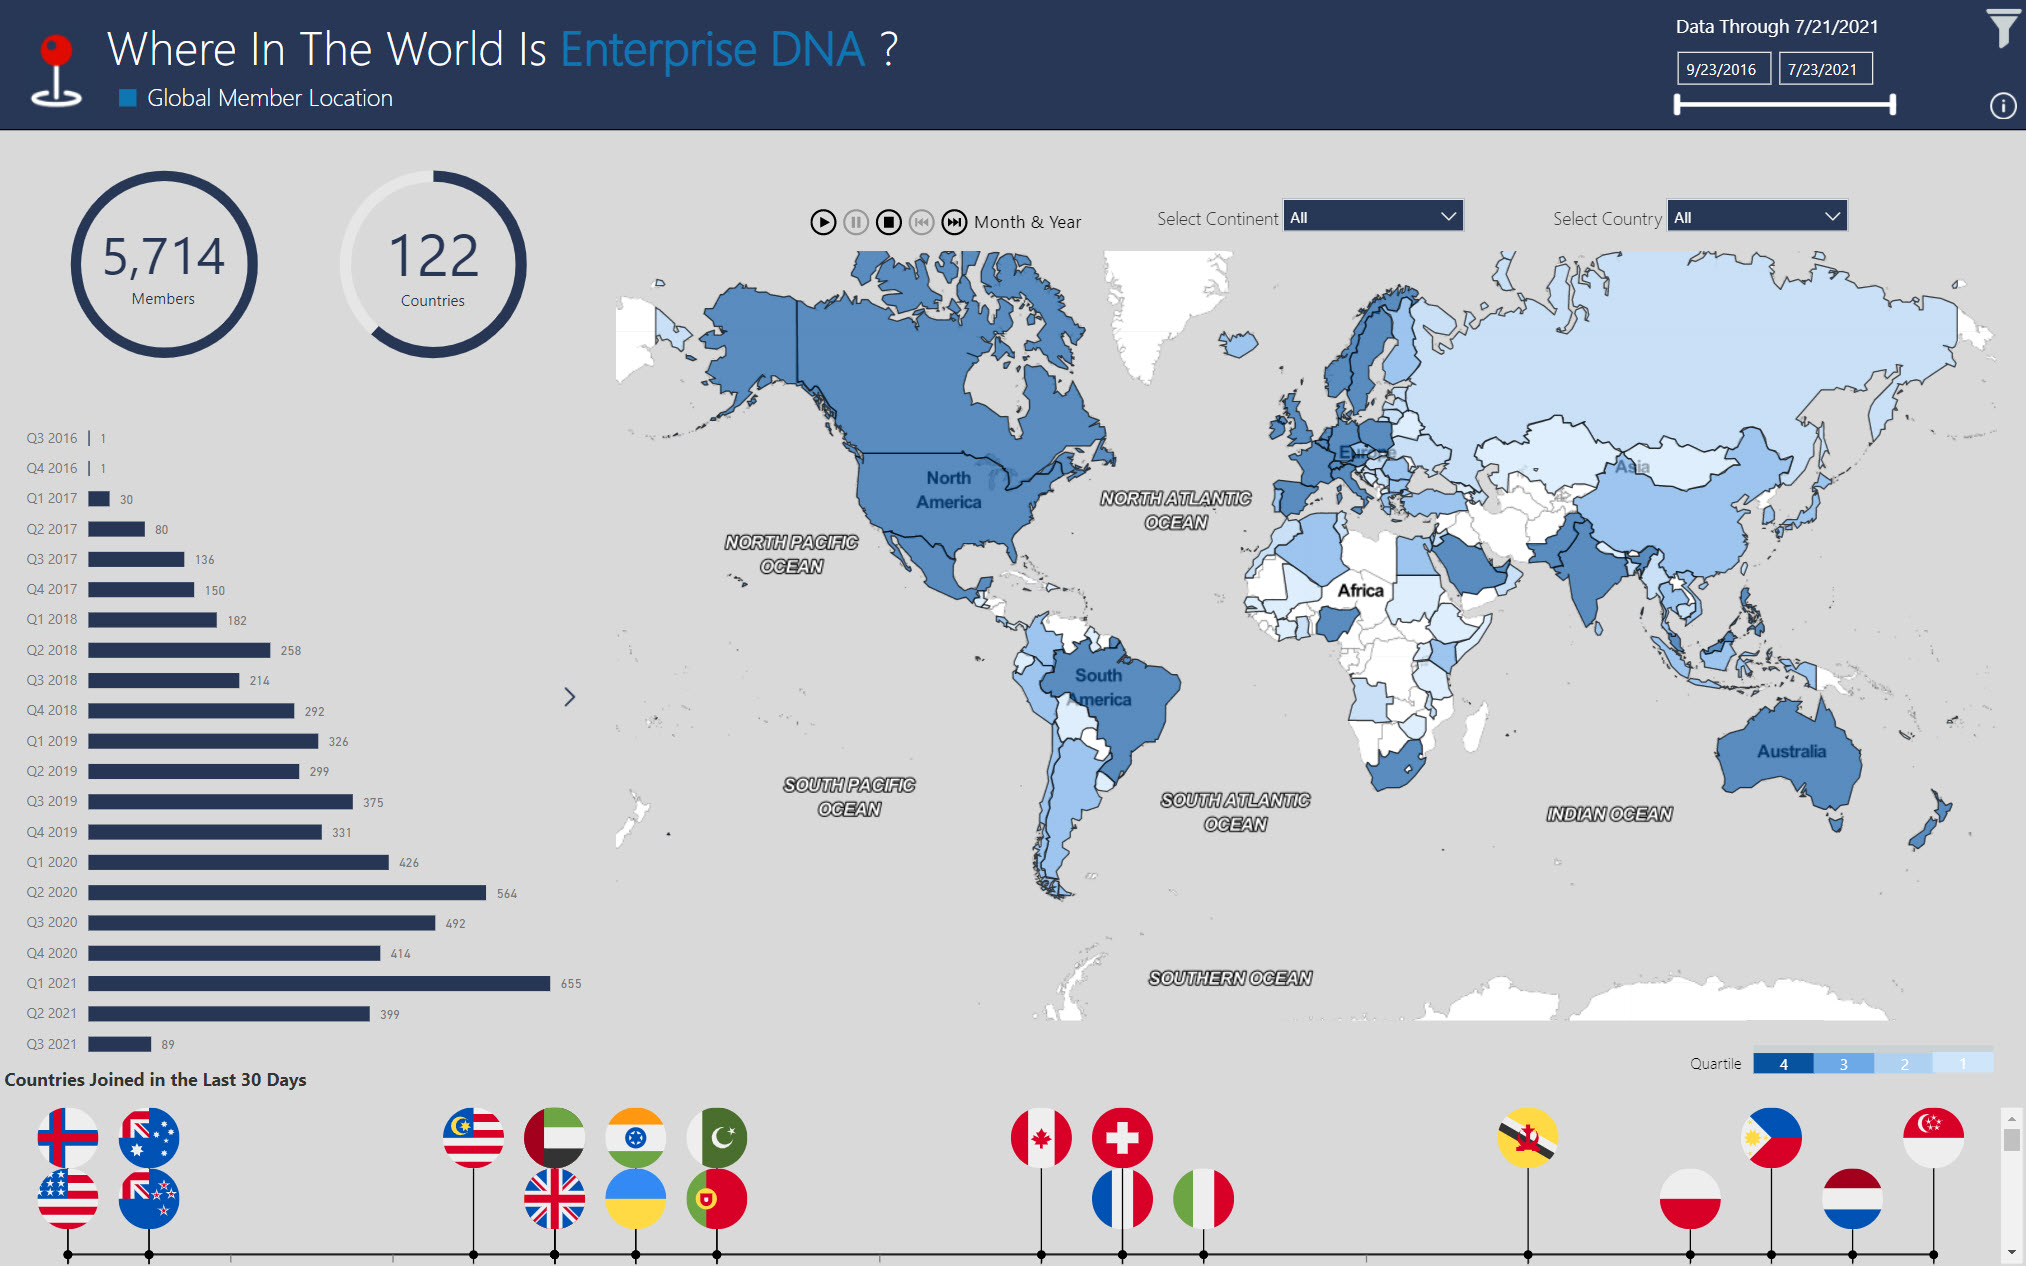
I love that Map Dashboard, is it possible to get a copy of it? I am working on similar project which will be looking at Continents, Countries, States, Cities, etc…
Hi,
You can download json files from the site below, David has prepared many maps for use in PBI.
If you want to make changes to a map, download a shapefile (*.shp), many world countries shapefiles are available for free. In one of my videos in the Geospatial course, you can find an example how to use QGIS and mapshaper to edit or create a map to use in a PBI visualisation.
Paul.
Thanks @BrianJ for the creation details. Looks very intimidating to someone who hasn’t done this level of map work. BTW, it seems like MyGeodata Cloud wanted to charge me for converting geojson to WKT. Is that correct?