Hi,
Can please let me know if we can tooltip for each measure in matrix visual(i have created report page tooltip for both measures individually but can’t add tooltip for both in main report).
Hi,
Can please let me know if we can tooltip for each measure in matrix visual(i have created report page tooltip for both measures individually but can’t add tooltip for both in main report).
Hi @Ravi85. I’m not clear on what you’re asking for; could you please produce a detailed mock-up of exactly what you’re looking forward for the forum members to review?
Greg
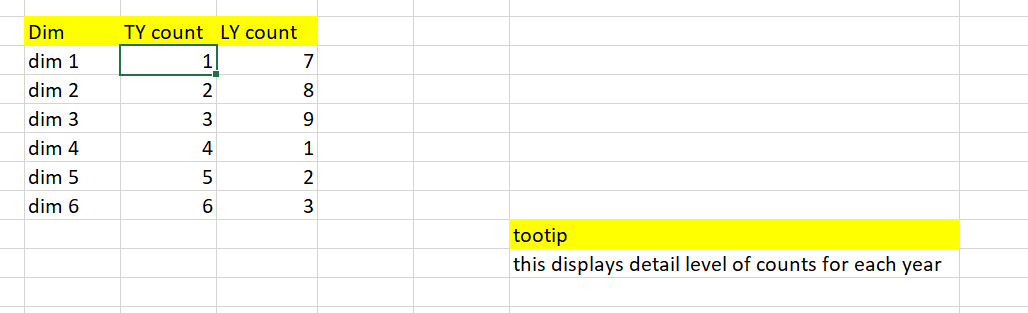
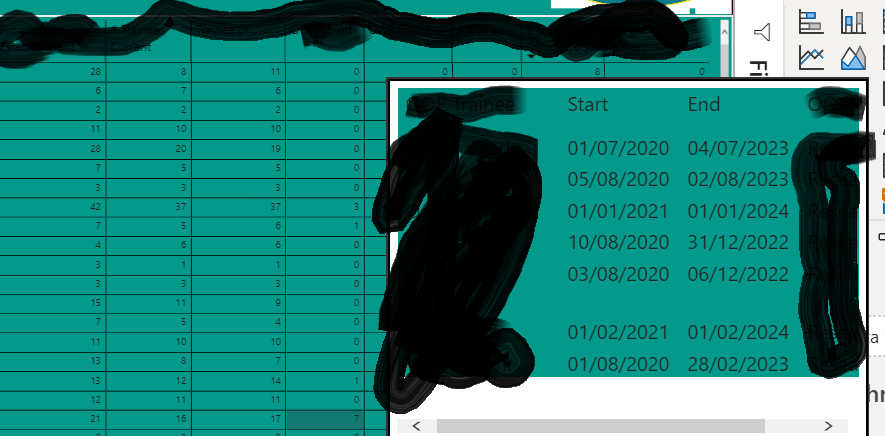
Thanks Greg for coming back and what i require is when a user hovers over a measure(matrix visual) i need tooltip for dynamically displaying detailed report based on measure.
TY count detailed(tooltip): will have start date,end date, product name
LY count detailed(tooltip): will have above details for last year.
Hi @Ravi85. Still not totally clear. Can you please attach your work-in-progress PBIX with the (I’m guessing) single tooltip and attach marked-up screenshots of exactly the two tooltips you’re looking for?
Greg
It is not possible to have a Tooltip that is individual to measures in a Matrix. Any Tooltip will show over every column and value.
Hi David,
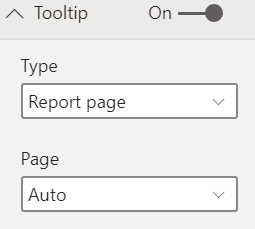
i fixed that by setting the report with below settings but my aim to add both measure display tooltips separately.
TY Count and LY count are different measures.
So, to be clear, you are wanting to add a description to each Measure which helps the user understand what the measure is calculating/summing?
yes exactly detailed level info for each measure.
You could place a box/button over each measure header that can act as a Tooltip, it will be blank and invisible as default but when you hover over it the colour will change and the text/description can reveal itself.
Depends on how much text/detail you are wanting to add in.
Apologies @Greg for my poor etiquette and jumping in on this one, thought I could help.
@Ravi85 - my suggestion would’ve worked if you’d just required a small text output and this could’ve been done as per @MudassirAli did in his Power BI Challenge 7 entry, link below. If you hover over certain KPI’s they replace as text.
Your requirements seem to involve returning a large table for each.
Unless you create a ToolTip page for each header, insert an object over the header and then use the visual header ToolTip to return your table. I’m not able to replicate just now or if that would work as you require. Do you follow what I’m suggesting?
Power BI Challenge 7 - Purchases, Inventory And Sales! - Power BI Challenges - Enterprise DNA Forum
No worries @DavieJoe … community discussion is one of the main purposes of this forum and is always encouraged. @Ravi85, I’m guessing you’re asking if you can have a different standard tooltip for different measures; if so, then no, but as @DavieJoe says, you can develop a custom tooltip page that will take your source matrix column and row into account (use hidden slicers on the tooltip page). If your issue still persists and you want further help, please prepare a sample PBIX and screenshots of the visual in question marked-up to show your desired outcome.
Greg
All,
To follow up on @DavieJoe’s suggestion, here’s a terrific video that @sam.mckay put together explaining how to create a tooltip “hotspot” anywhere in your report using transparent card overlays:

Adds a lot of options and flexibility in terms of where you can place active tooltips beyond what the PBI visuals generally allow.
Some evening viewing for me 
thanks all
finally managed to achieve this by drill through report.
Great to hear you found a solution that works for you!