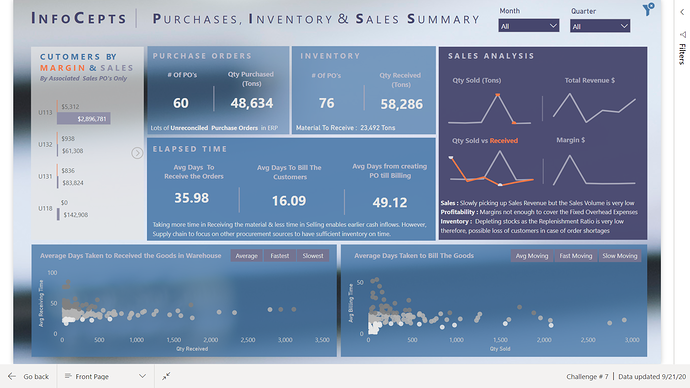
This is my submission for challenge # 7 :
1st Technique:
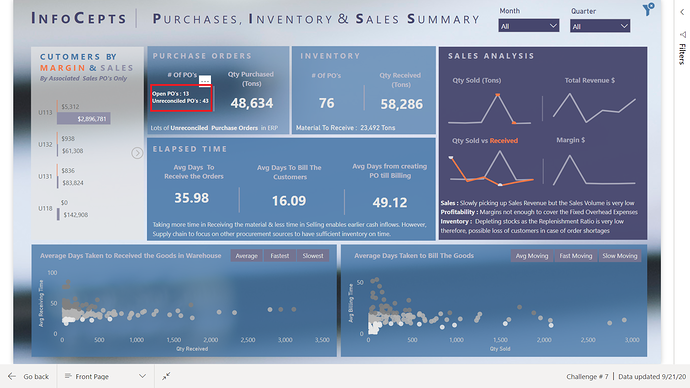
As it was mentioned in the task to keep it as brief as possible therefore, tried to use a new trick that I never used before called “Embedded Hover Over Tooltip Effect” on a Card & on Headings as shown below:
To see the tooltip hover over the cards or in case of charts, hover over the chart headings.
2nd Technique:
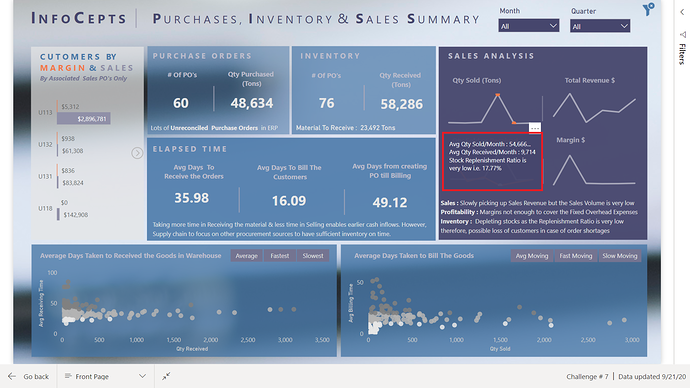
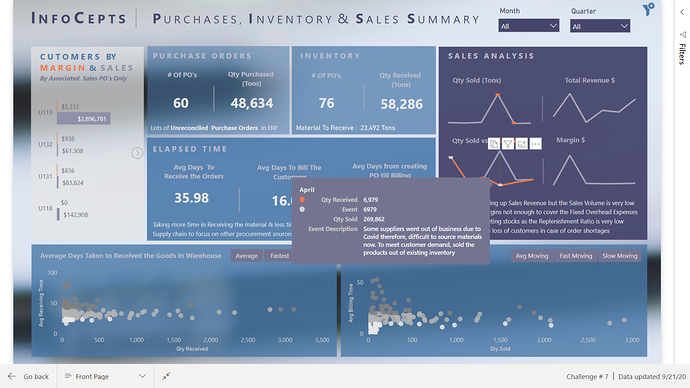
Another technique used called " Chart Annotations" where the events are described via tooltip as follows:
3rd Technique:
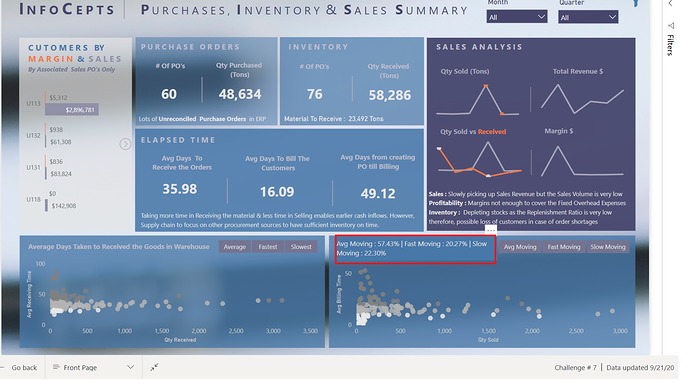
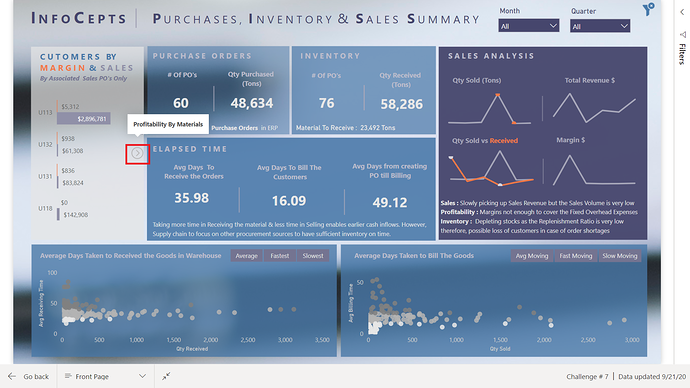
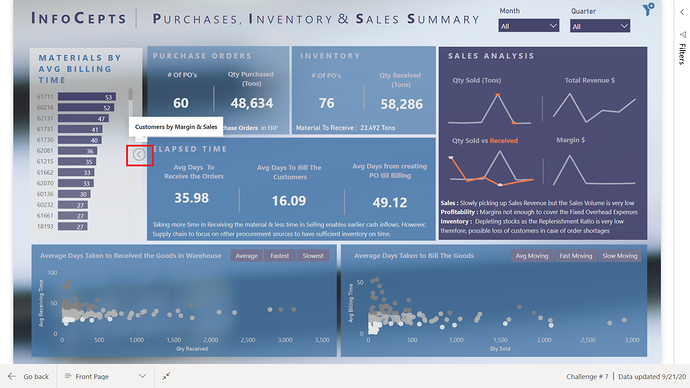
This technique is a bookmark (Next Image) to go to different visual for analysis. When hovering over the image it will indicate what’s the next visual is.
When the last visual is reached the image position will change indicating to go back to the first visual.
At the end scatter charts show the average times taken to arrive at the warehouse and to bill the customers characterized by average, fast and slow moving. The management can see and try to take actions for slow moving inventories and for the materials that take longer time than usual to receive in warehouse.
It looks like a very brief report but the amount of measures created in this challenge is a lot.
Next week is also my final Budget presentation therefore, submitting the challenge now.
Hope I managed to tackle the requirements of this challenge.
