The situation I’m looking to solve is forecasting when inventory will run out. I want to calculate this by taking Inventory and subtracting the sales order quantity up to the last sales orders date. After there are no more sales orders to subtract from, start subtracting by the daily average sales to determine when that inventory will hit 0.
There are a few measures that i created that I believe help set this up.
Runtot = CALCULATE(SUM('Sample SO Data'[Quantity]), FILTER(ALLSELECTED('Sample SO Data'), 'Sample SO Data'[Shipment Date]<=MAX('Sample SO Data'[Shipment Date]) && YEAR('Sample SO Data'[Shipment Date]) = YEAR(MAX('Sample SO Data'[Shipment Date]))))
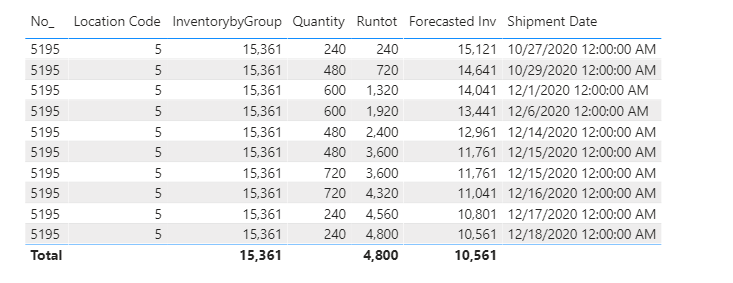
Forecasted Inv = [InventorybyGroup] - [Runtot]
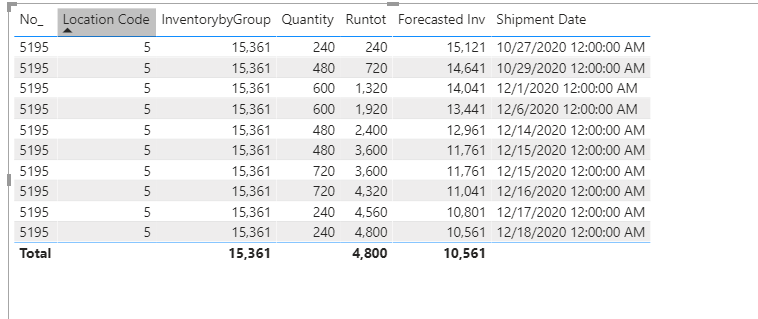
As you can see I can get the [Forecasted Inv] measure to subtract up to the last Shipment Date.
Would it be possible to continue the dates listed after the last shipment date and then keep on subtracting by the daily average?
I have attached a PBIX file with all of the corresponding calculations except for the subtractions of the daily average sales. How would I be able to approach this?
Thanks for any help! Let me know if I need to provide more context for this situation. Sample Inventory Forecasting.pbix (842.3 KB)
Thank you for your reply. I have thought about this but then my issue would be that it’s not taking into account the sales orders quantities. The important part is to be able to retrieve the date that the inventory will hit 0. Basically taking the last Forecasted Inv value (10,561 in this case) and then continuing a subtraction of the daily average.
Basically a rolling subtraction where you first deduct the sales order, then after the last sales order is subtracted, start subtracting the daily average sales until it hits 0 or is less than 1.
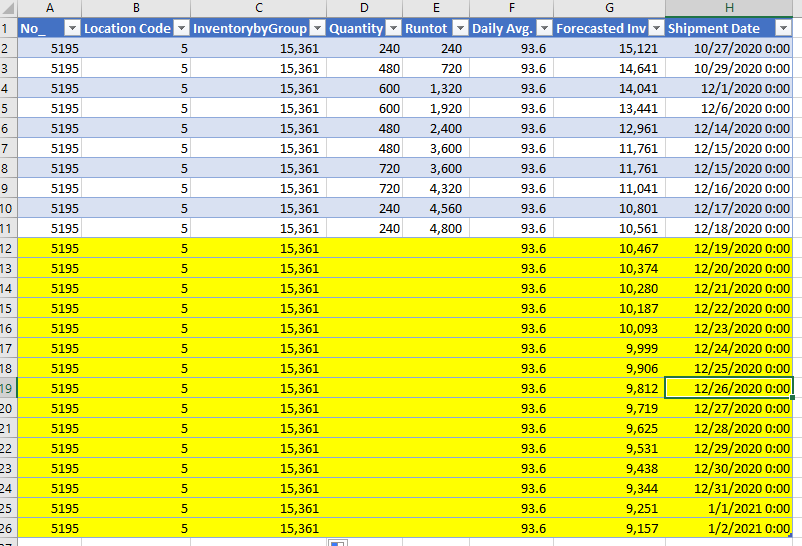
I have attached a mock up of my desired final results however I wish for it to continue until the ForecastedInv hits 0. The first half of the table are what I can achieve at the moment.
The first image are what I can achieve right now. The highlighted parts in the following image are my desired results.
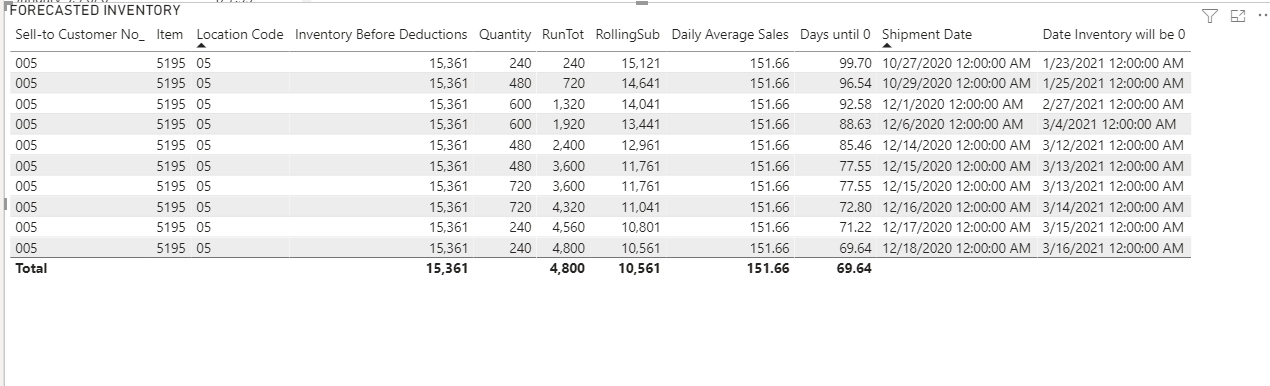
So I’ve been pondering this issue here. I’m thinking that the best course of action here would be to create a table in the database that takes an average of daily sales by item their segment. Then I would also take the total amount of inventory for the segment and add these 2 columns to the sales order table. I would also create a rolling subtraction column in the sales order table. Then after dividing the rolling subtraction column by the daily average sales column, I would take this results and add it to the Shipment date to get the exact date inventory will hit 0.
It’s definitely not a pretty solution. I’m not sure why but i’m having trouble adding the “Days til 0” measure to the shipment date when i attempted to create a calulated column which is why im thinking of taking this new direction.
An alternate desired results would be like the one attached.
Hello @dataray, due to the length by which this post has been active, we are tagging it as Solved. For further questions related to this post, please make a new thread. When starting a new post, I suggest linking this thread, provide as much context to a question as possible and include the masked demo pbix file, images of the entire scenario you are dealing with, screenshot of the data model, details of how you want to visualize a result, and any other supporting links and details. Thanks!
Hi @dataray, did you find a solution to this query?
I have a similar issue where I have a starting stock quantity, for the current week and a weekly average sales quantity taken from the the past 3 months sales. I need to predict the subsequent weeks projected on hand stock by subtracting the cumulative average weekly sales from the starting on hand stock quantity. Depleting stock.xlsx (10.0 KB)
Basically, I need to find a DAX formula that will successfully calculate the cumulative average weekly sales, as per the sample highlighted on the attachment.
Hey Pete! Yes I did find a way to go about this based on this article For and While Looping
The only difference is that I created a joint table between the averages and the future days from today. So basically I assigned the averages to future dates. The function i used was the CROSSJOIN function, which assigned my unique identifier,“CUSTOMER, ITEM, LOCATION” to each date that was specified. I can go in depth in how I did this if you want but the issue with this method in my opinion is that the averages won’t be dynamic if you need them to be.
I’d be happy to answer any questions you may have.
Sorry Pete I think I misunderstood your question here. Are you looking for how many weeks of stock you have ? If that’s the case then it is just a matter of dividing your stock quantity by your weekly average sales.
If you are trying to find how much inventory you will have on hand week by week on a certain date, I refer you to the article i linked above.
Thanks for the quick response! And, yes, I’m trying to project stock on hand quantity week by week, creating an averages table may be a solution for me. I’ll check out the article.