Thanks!!
There are few straight forward reasons before I explain why I use it so often.
-
KEEPFILTERS creates a SET intersection between what is written in the code and what is available in filter context outside CALCULATE: slicers, rows, columns
-
Makes it easier to write predicate/boolean conditions without overwriting the existing filter context. The end result is more readable and elegant looking
-
By using KF you are able generate more efficient queries with column filters, since now you don’t have to iterate a full dimension or fact table
-
Writing predicate ensures you only get unique existing combinations and KEEPFILTERS ensures that filters inside CALCULATE and outside CALCULATE intersect
Predicate statement = KEEPFILTERS ( Products[Color] IN { "Red", "Green", "Blue" } )
Non predicate equivalent =
FILTER ( Products, Products[Color] IN { "Red", "Green", "Blue" } )
- Not used very commonly but you can use KEEPFILTERS with iterators too, in that case it creates an intersection between context transition and the existing filters.
Measure = SUMX ( KEEPFILTERS ( ALL ( Products[Color] ) ), [Total Sales] )
I am going to use Contoso dataset with 12.5 Million rows for the demonstration.
Let’s say you want to create a report showing sales only for trendy colors otherwise blank.
you would want to write the measure in the following way so that you want the sales of the colors that are trendy plus included in the slicer
Trendy colors =
CALCULATE (
    [Total Sales],
    FILTER ( Products, Products[Color] IN { "Red", "Green", "Blue" } )
)
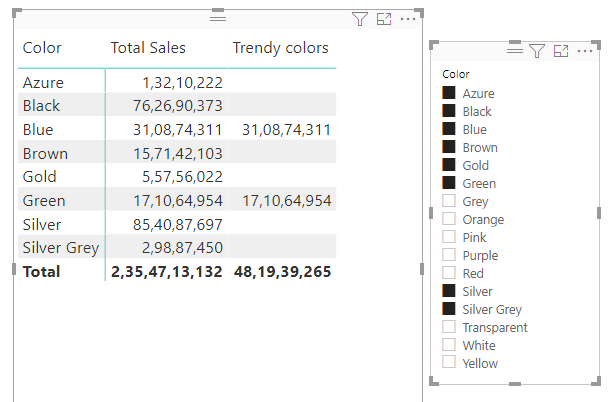
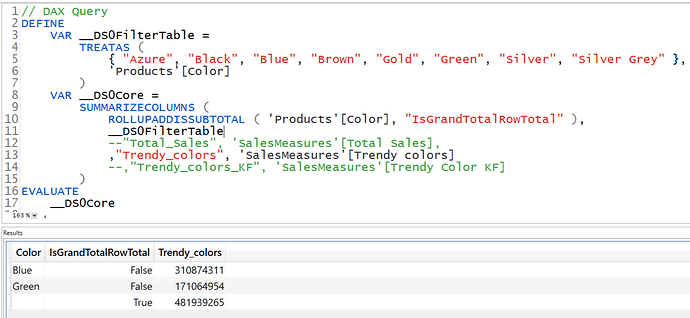
So far everything is fine no issues. Now lets see the query generated by this measure.
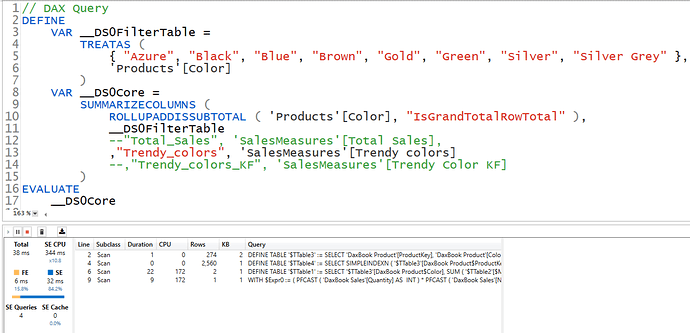
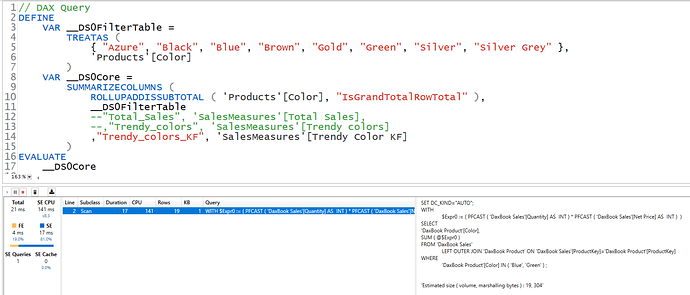
Pay attention to the number of Rows this measure had to iterate, because we used a full table inside CALCULATE, a full scan is also done to retrieve the values.
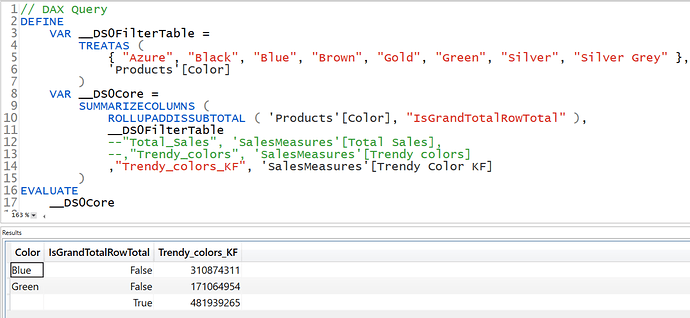
If on the other hand I modify the measure a little bit by introducing KEEPFILTERS, look at the query generated and the result is same too!
Moving on to a more complex example.
Now we are trying to calculate sales amount where quantity * net price is greater than 1000.
Some might write the code like this:
Sales Amount GT 1000 =
CALCULATE(
    [Total Sales],
    FILTER (
        Sales,
        Sales[Quantity] * Sales[Net Price] > 1000
    )
)
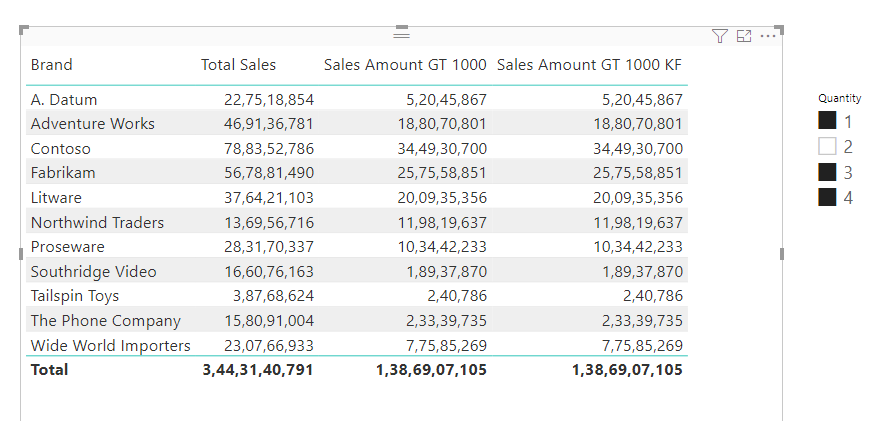
this works fine and you can interact with slicer and obtain the result depending on the quantity you select.
and same can be done with the following, look at the ALL statement it will contain unique combination of Quantity and Net price and once the product is greater that 1000 only the values of these 2 columns would be applied to the filter context.
In case of full table the all the columns of the sales would be applied to the filter context and that could be very expensive in case there are a lot of columns, and to be honest I don’t think you would need every column of a table to get the result. And the number of rows applied to the filter context are huge too!
Sales Amount GT 1000 KF =
CALCULATE (
    [Total Sales],
    KEEPFILTERS (
        FILTER (
            ALL ( Sales[Quantity], Sales[Net Price] ),
            Sales[Quantity] * Sales[Net Price] > 1000
        )
    )
)
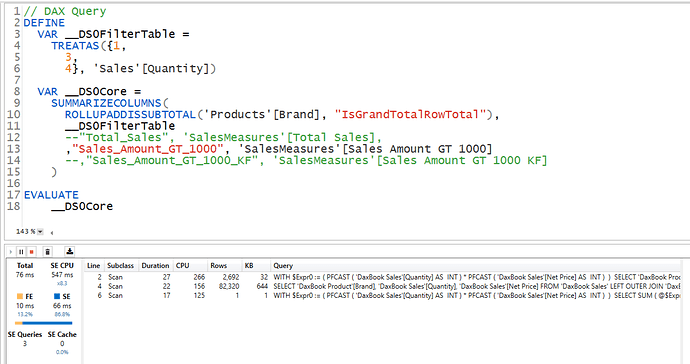
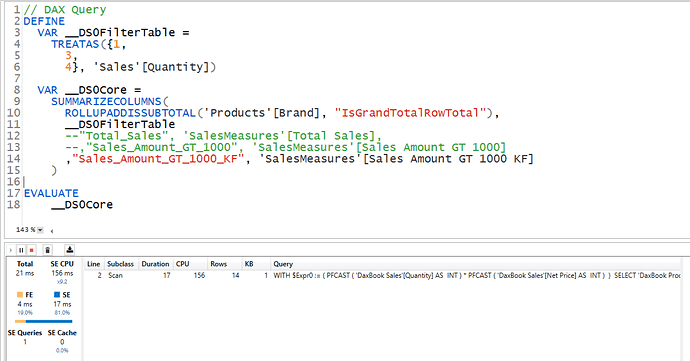
Let’s pay attention to the queries generated by these 2
without KF query:
with KF query:
by now you can see how many rows the SE engine has to bring back to get the desired result.
Another example:
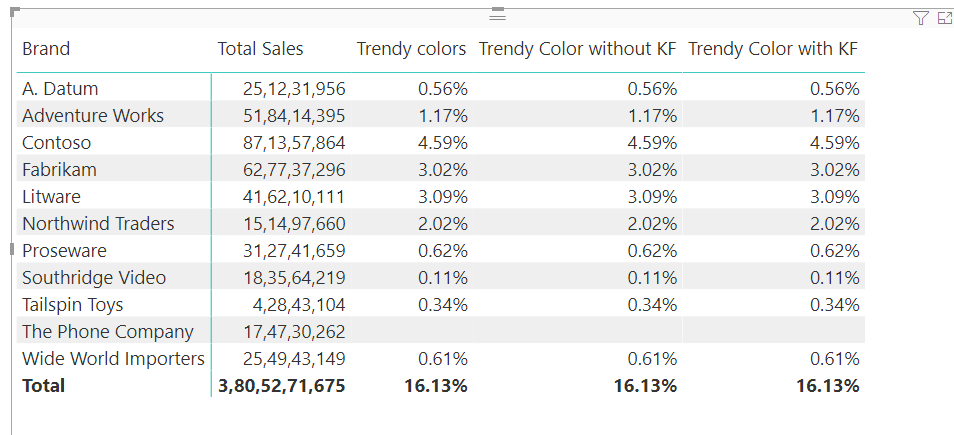
Let’s say you are slicing trendy colors by brands.
Measures used -
Trendy colors =
DIVIDE (
    CALCULATE (
        [Total Sales],
        FILTER ( Products, Products[Color] IN { "Red", "Green", "Blue" } )
    ),
    CALCULATE ( [Total Sales], ALL ( Sales ) )
)

Trendy Color without KF =
DIVIDE (
    CALCULATE ( [Total Sales], Products[Color] IN { "Red", "Green", "Blue" } ),
    CALCULATE ( [Total Sales], ALL ( Sales ) )
)

Trendy Color with KF =
DIVIDE (
    CALCULATE (
        [Total Sales],
        KEEPFILTERS ( Products[Color] IN { "Red", "Green", "Blue" } )
    ),
    CALCULATE ( [Total Sales], ALL ( Sales ) )
)
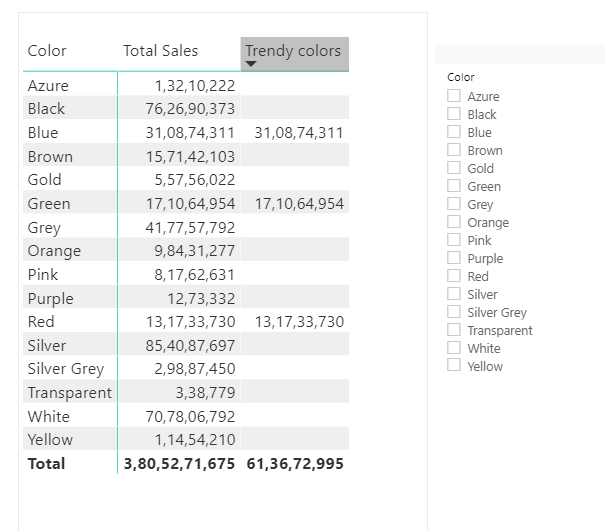
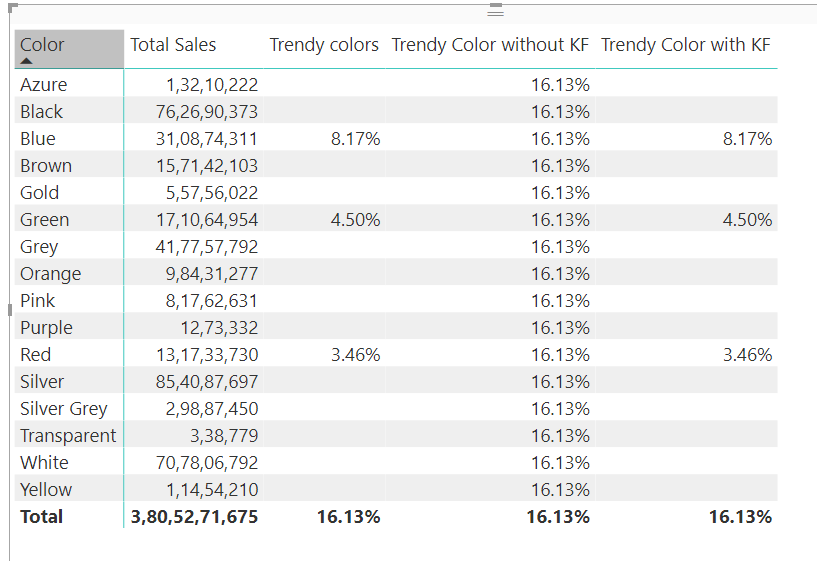
You can see all 3 measures return the same result, but the difference is evident when you slice by colors
That’s why I use KEEPFILTERS more often as it helps in creating elegant and efficient code  But knowing when to use it is absolutely necessary.
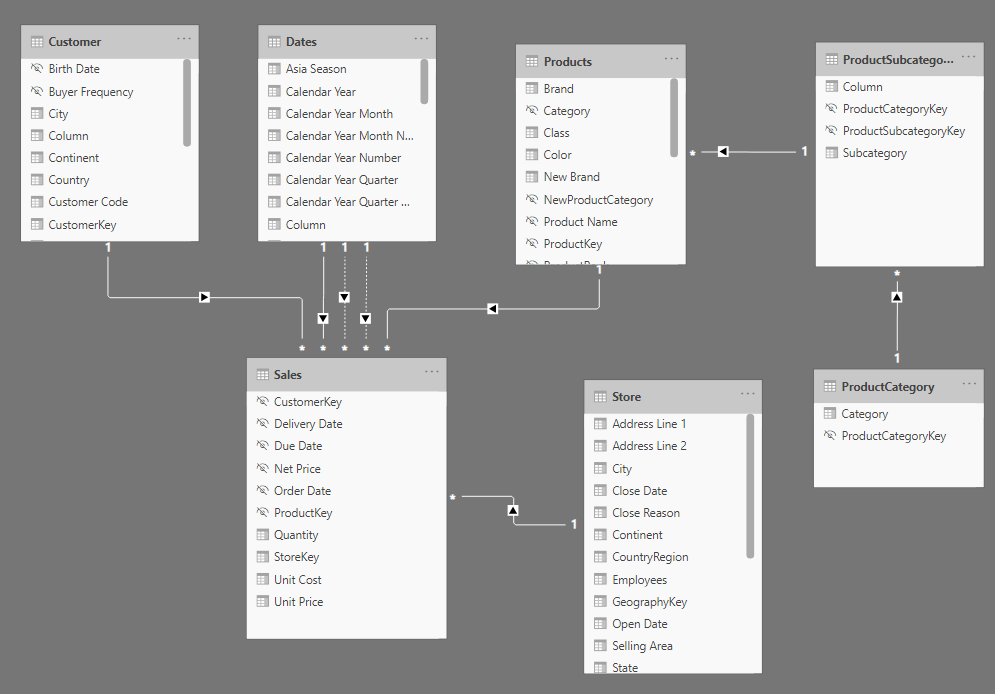
Here is the snapshot of the data model, don’t hate me for snow flake schema that’s only for learning purpose 
![]()

 But knowing when to use it is absolutely necessary.
