Table Relationship or DAX Issue

Hi,

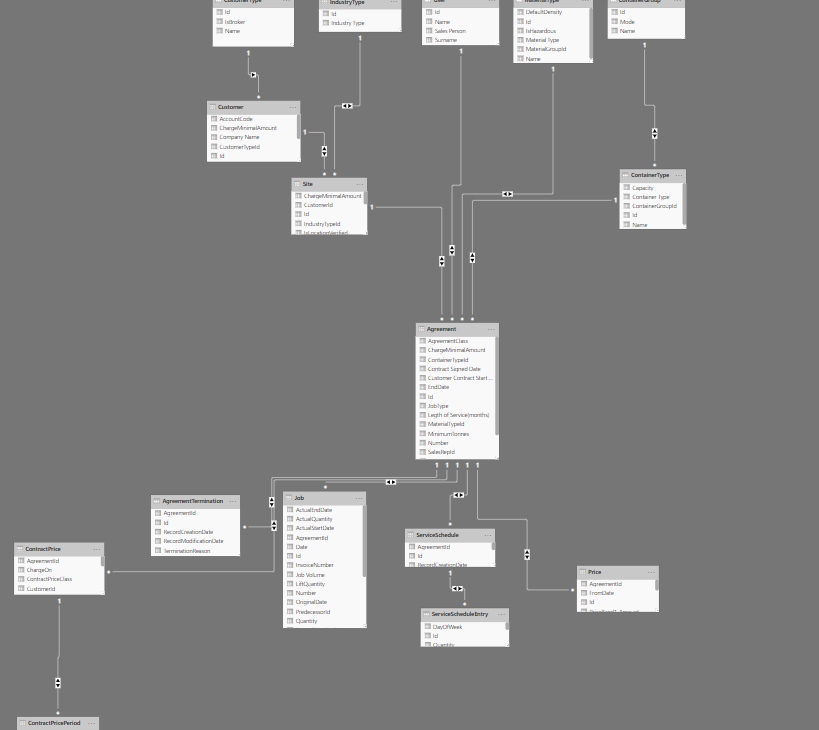
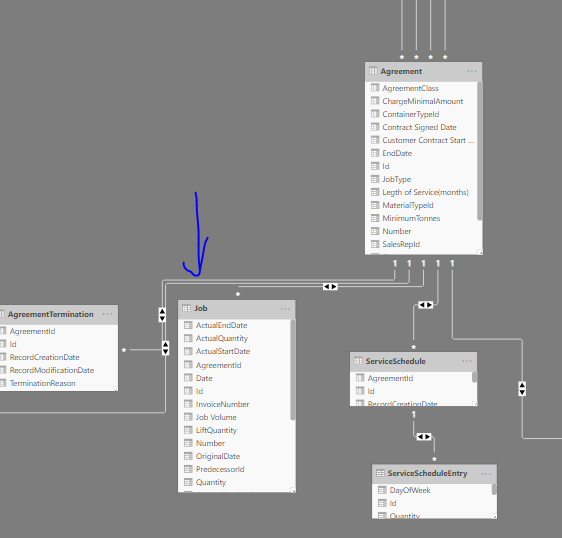
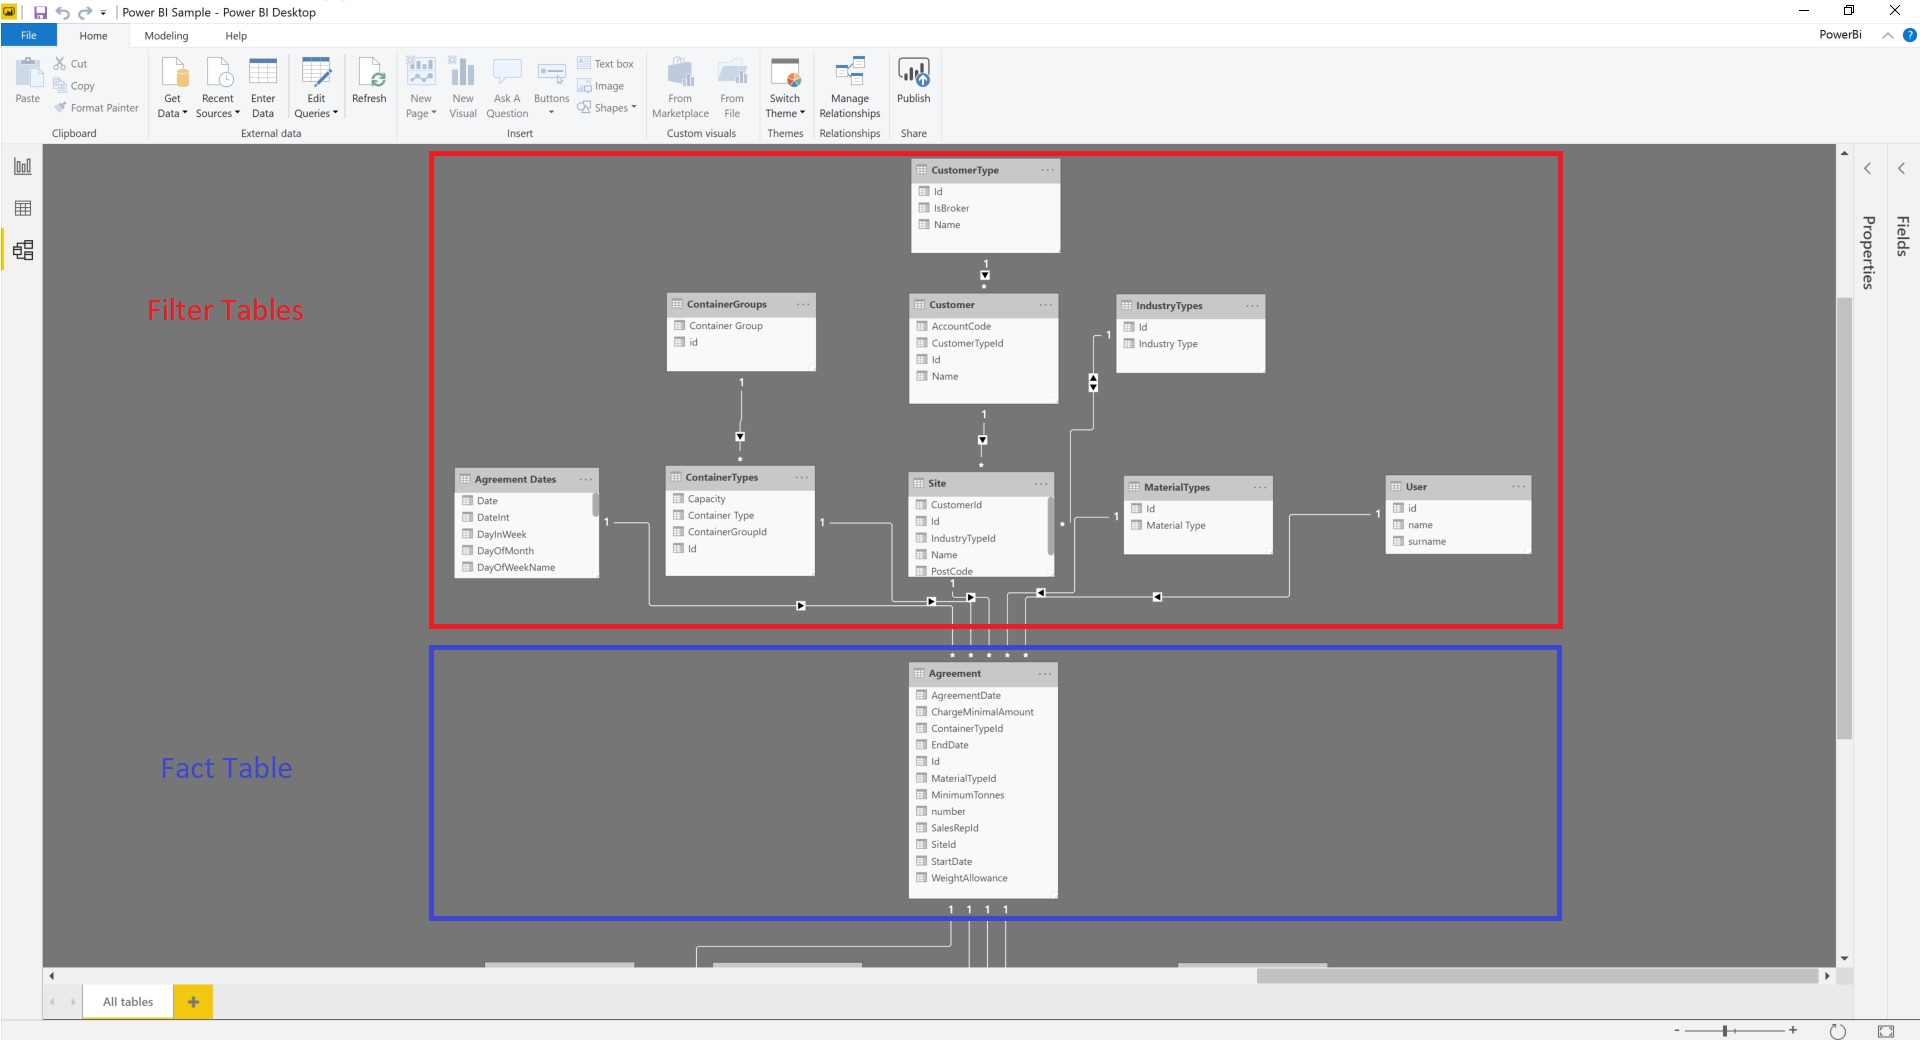
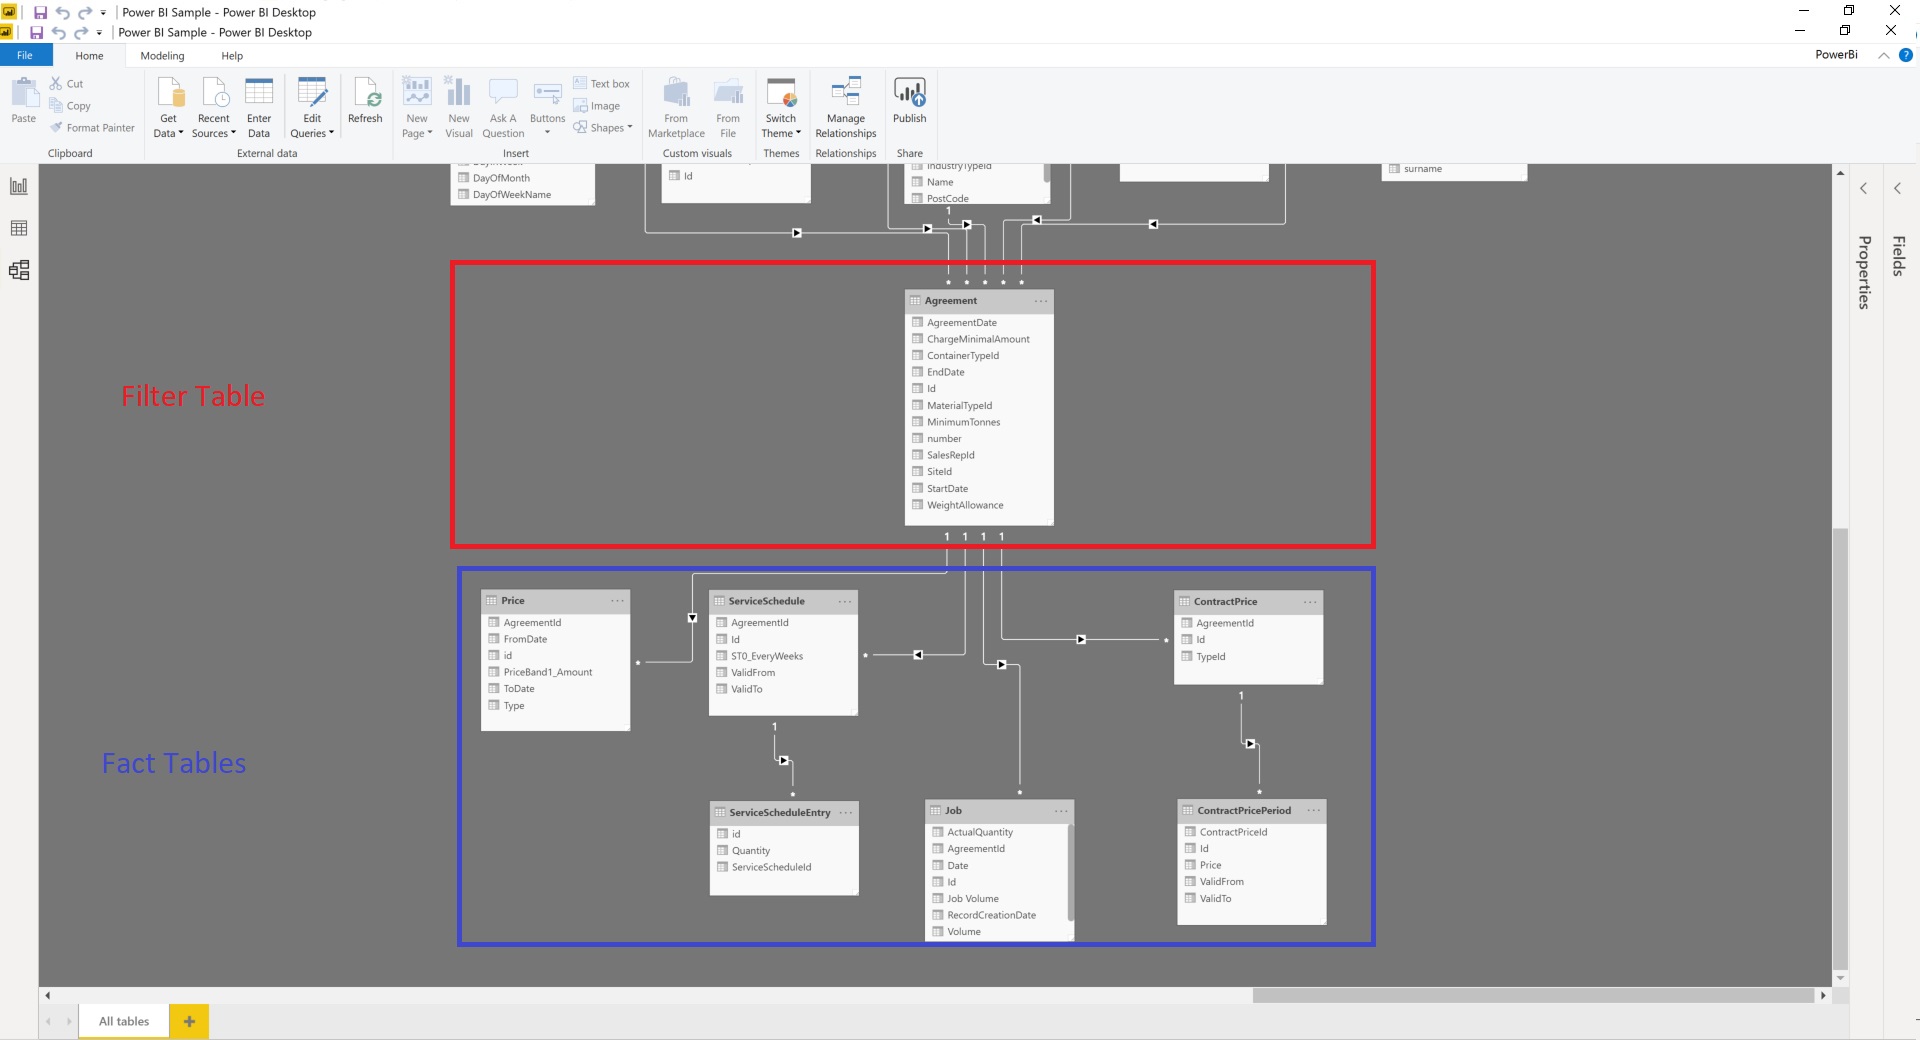
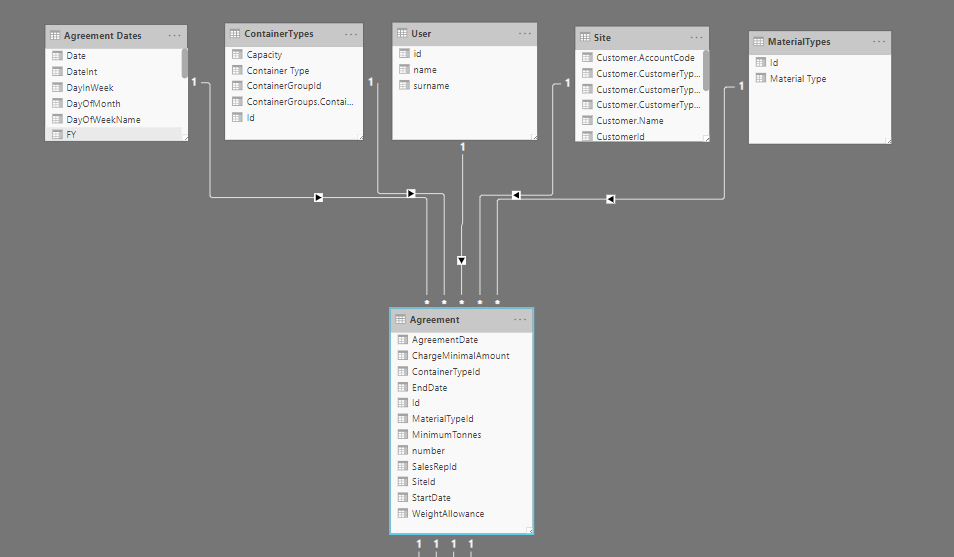
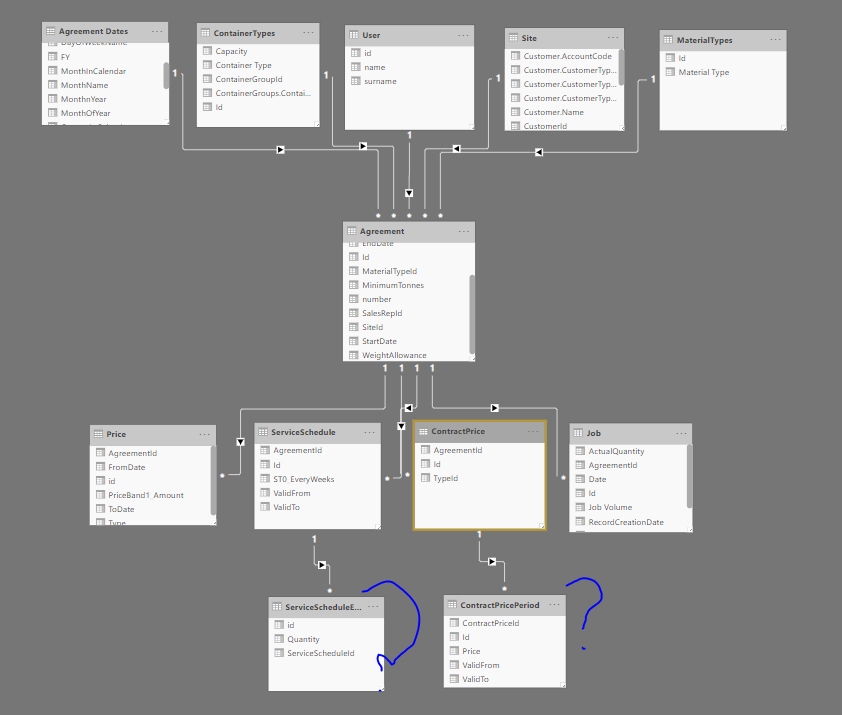
Please can you take a look at my report, I would like all 3 report tabs as 1 report but there is something wrong with the relationships as I’m getting multiple lines for 1 record.

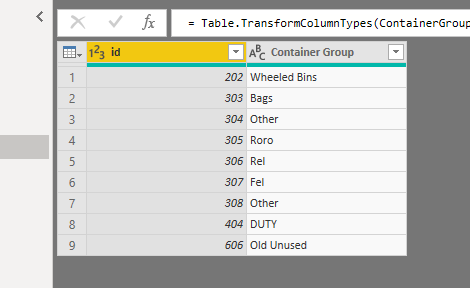
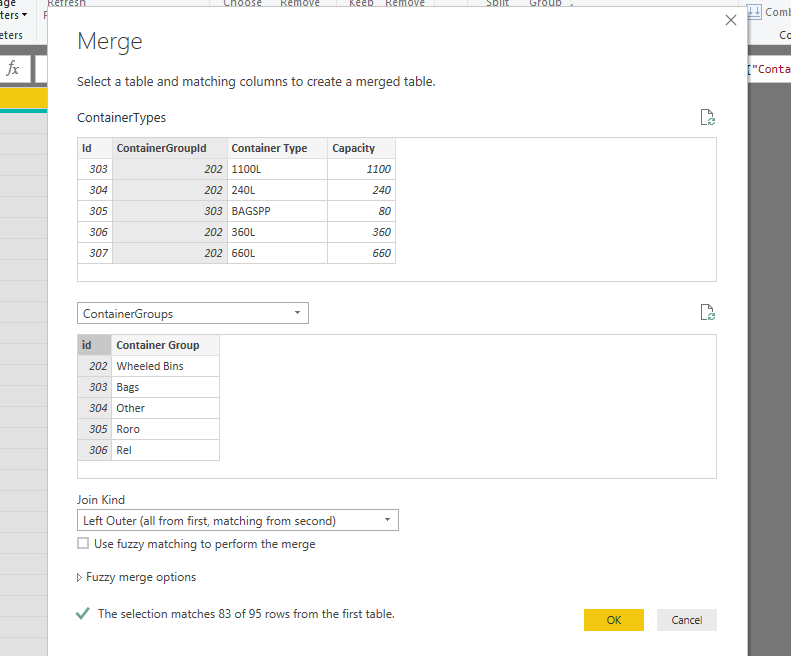
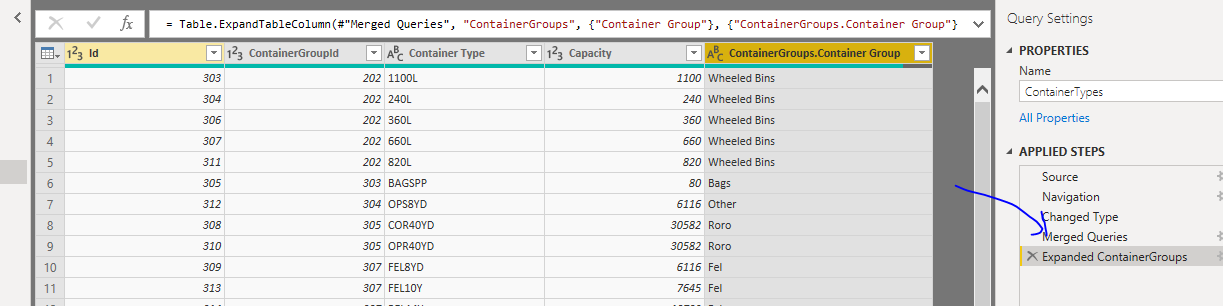
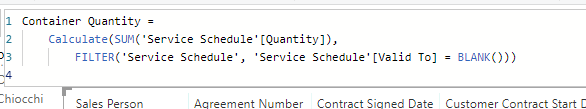
The Container Type seems to be like a full join, all of the container types are being displayed causing the 1 record to have multiple lines. If you add Container Type to the part 2 report you can see what happens.

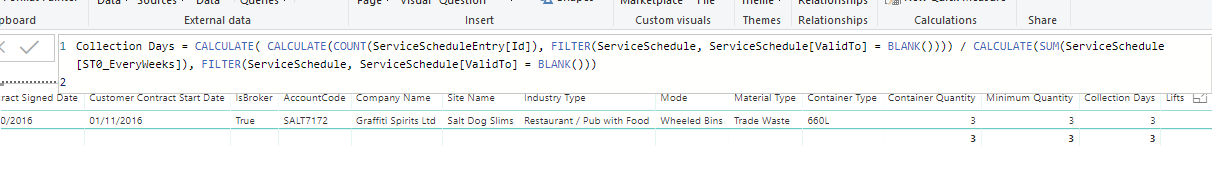
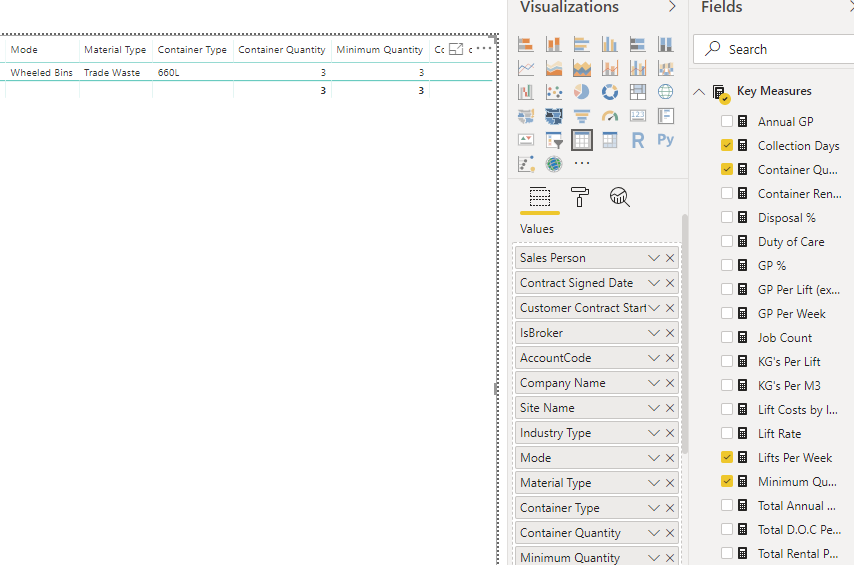
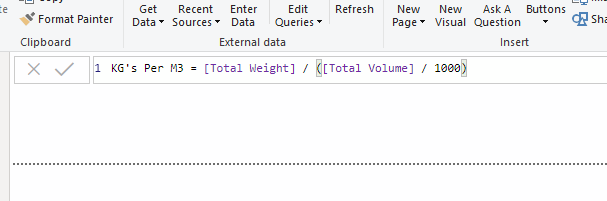
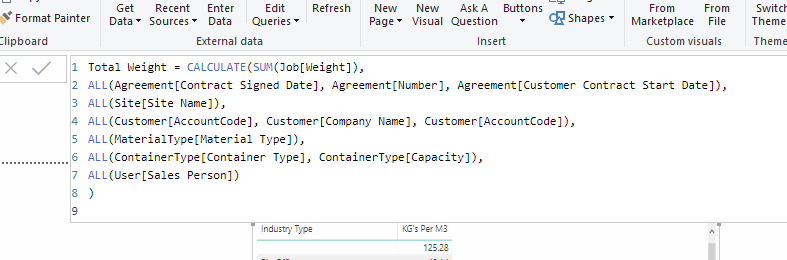
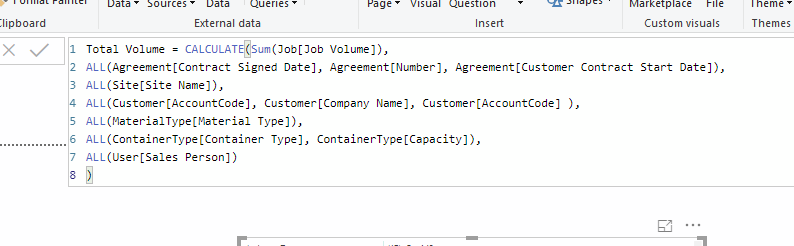
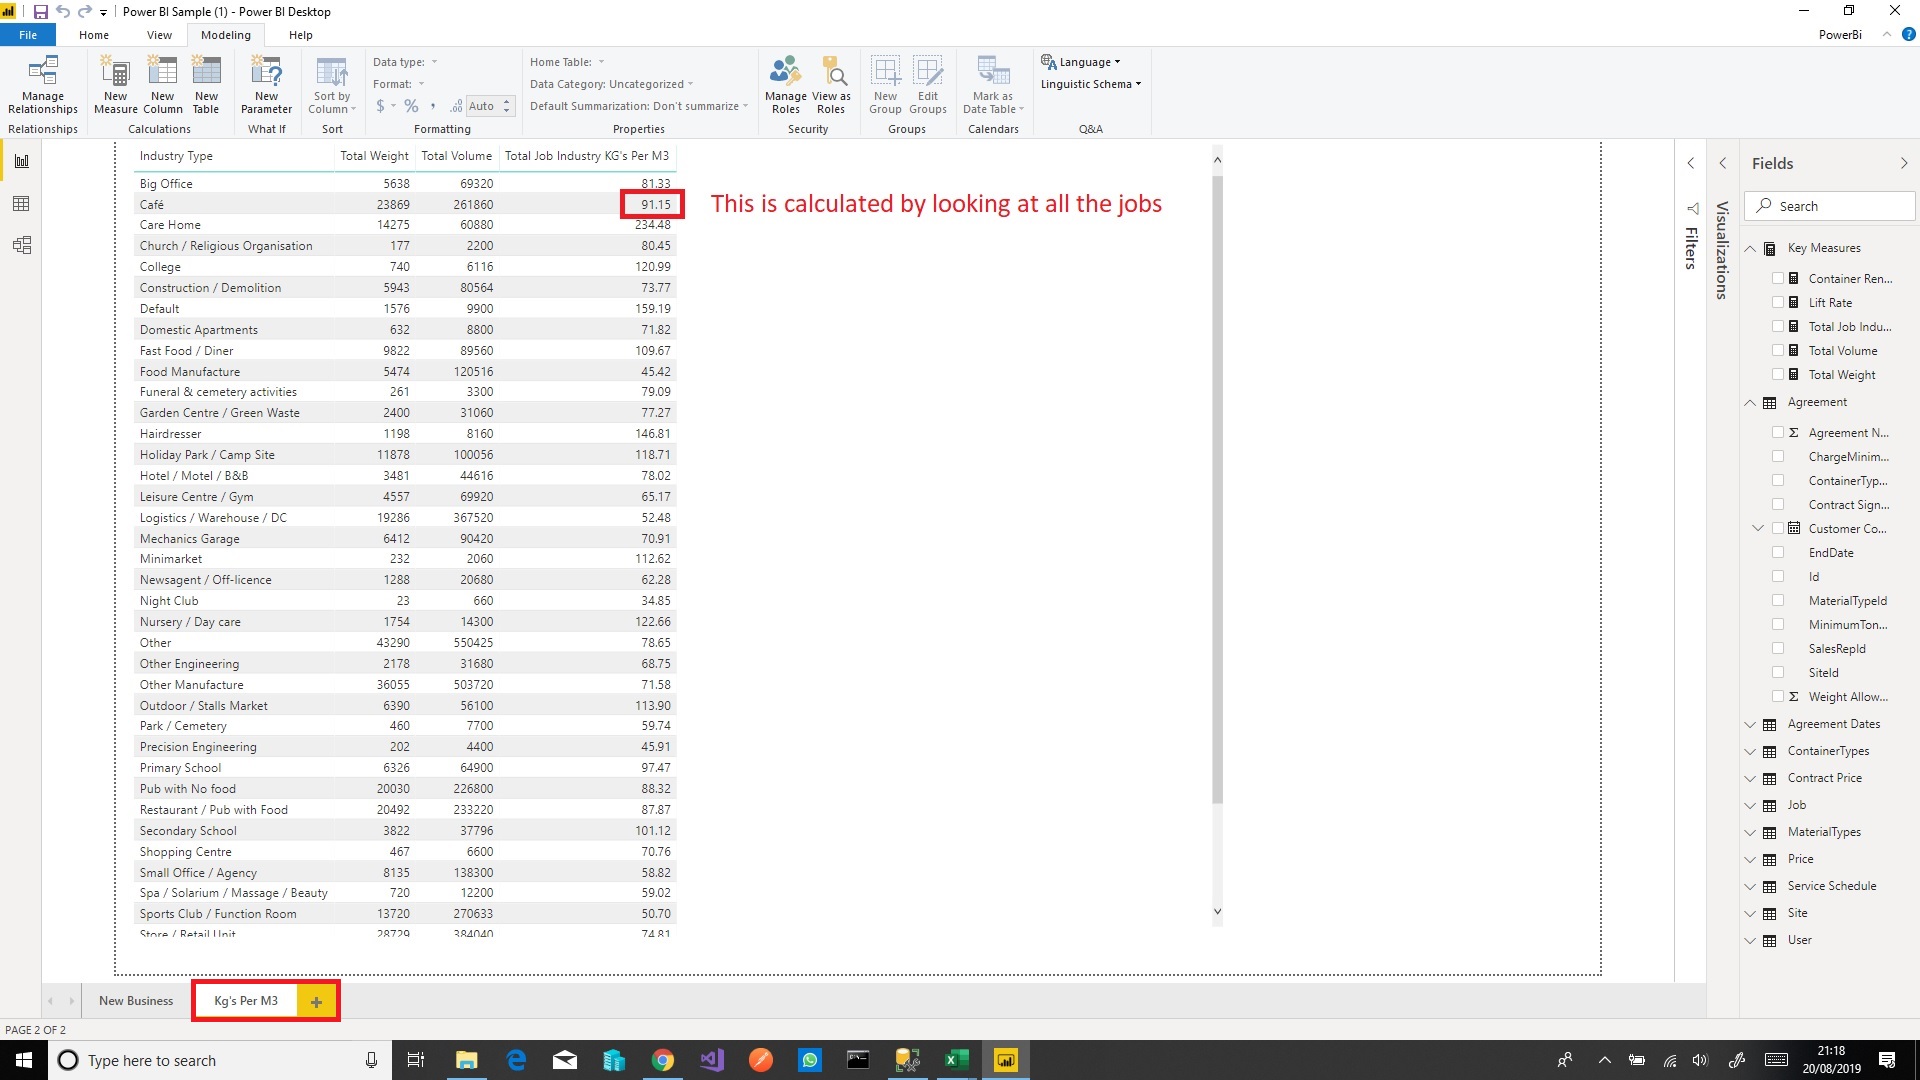
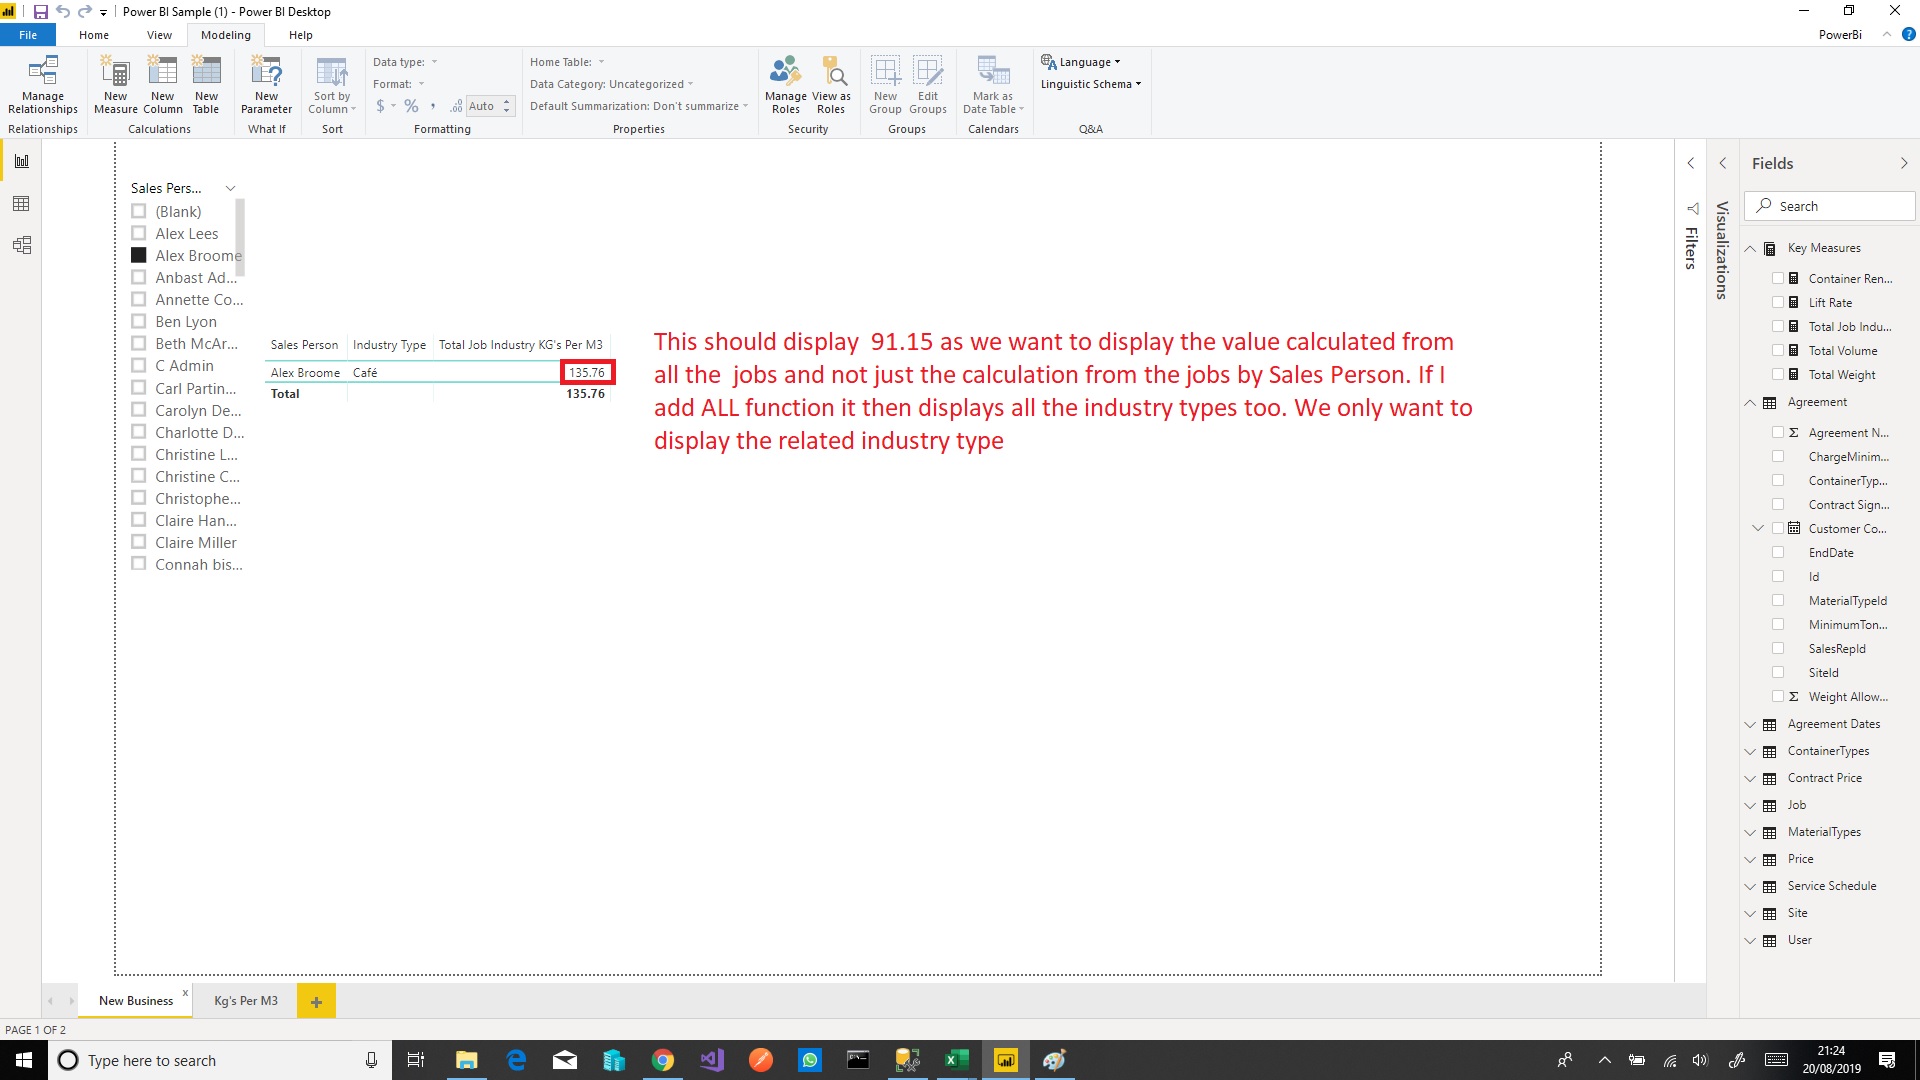
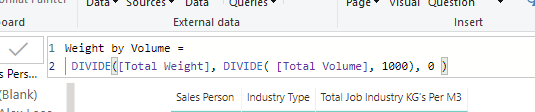
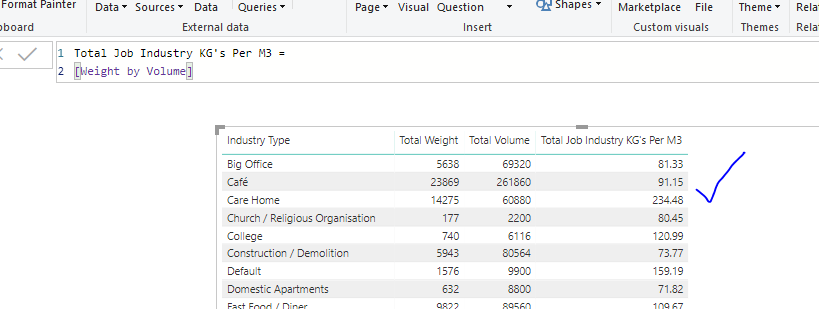
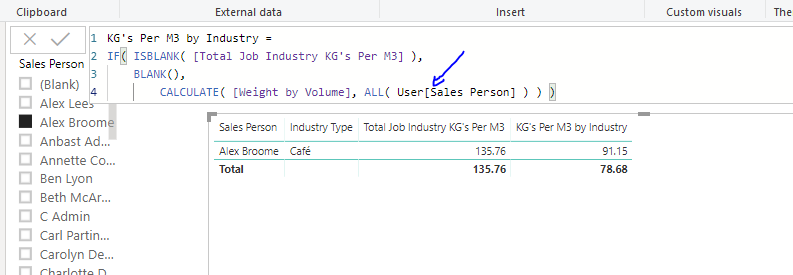
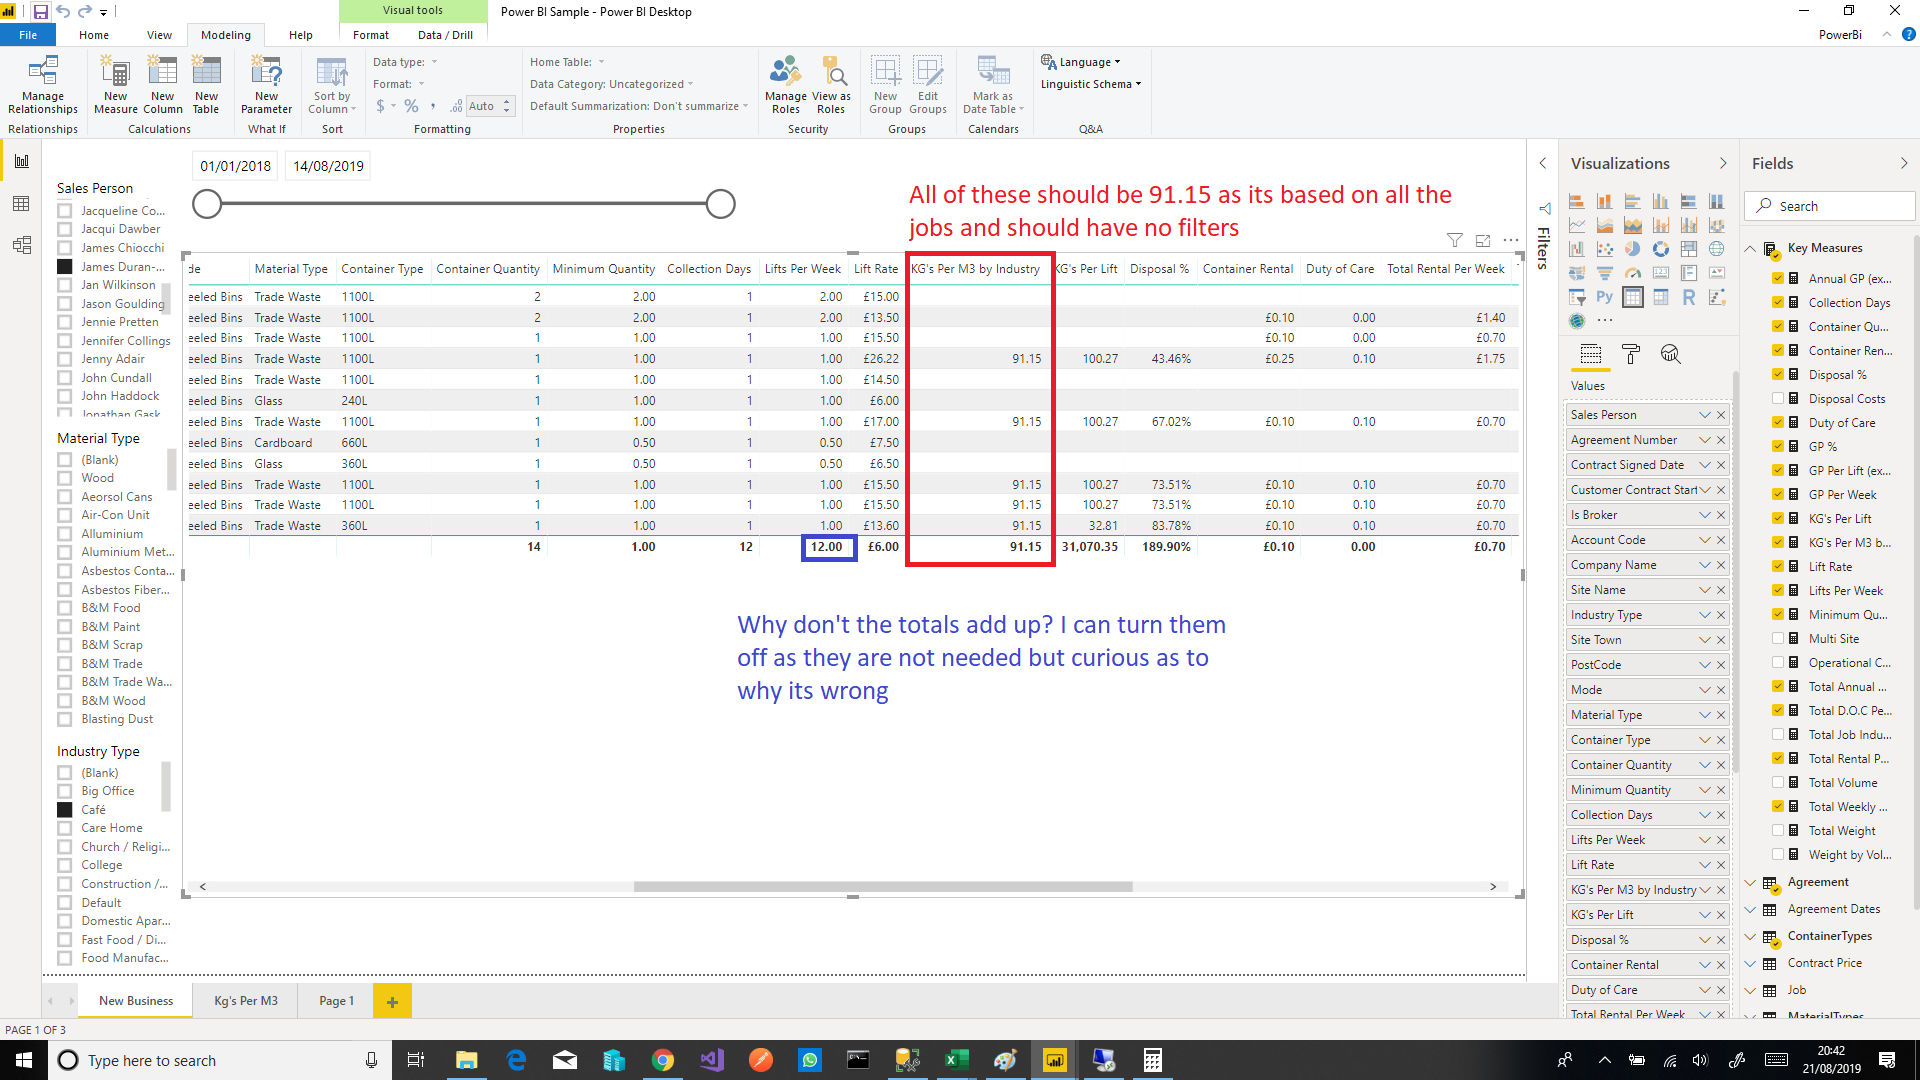
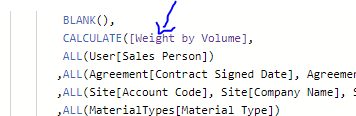
The Tab “kg/m3 by industry Type” calculates the average weight in kg per industry type from all the jobs since 1/1/2019, when I add this to the table it also multiplies all the rows, I need a way to get this measure to only display the kg’s/m3 with regards to the industry type as per the record in the site.industrytypeid field. I think it a problem with the context, I’ve removed all the filters but I’m stuck how to resolve the problem. If you try to add all the fields from ‘New Customer or Site Part 2’ to the first tab ‘New Customer or Site’ you will see my issue.

Many Thanks Nathan

Hi Nathan,

In future please find a way to add everything to the forum. If the file size is to big, create a demo file that is smaller.

The best thing to do here is create a demo file which really drills into your problem so that it can be easily reviewed.

For all other tips for asking questions on the forum see here.

https://forum.enterprisedna.co/t/rules-and-tips-for-asking-support-questions-on-the-forum/30

First,

You are never going to get very far in Power BI with a model setup like this.

Please review this course as soon as you can to implement best practices in this area.

You really want to simplify your model here and set it up in a way that is easy to understand exactly what is happening when you place filters and measures together in your report.

Some other observations,

Highly recommend setting up your formula far more intuitively using some simple formatting.

Then if you are experiencing issues, break things down into simple chunks.

When I look at this myself I have no idea what could be the issue as it could be many things.

Break it down and look at each measure by itself.

Also check your filters here.

image

try to get these in the report page as slicers so they can be a little more dynamic. Placing them here isn’t useful in my opinion.

I would start with these recommendation first as I’m a little confused where I should even start to assist here with the solution.

I just see a large model that isn’t optimized and not sure where to go or what to focus on to assist.

Thanks
Sam

Just drilling down into this formula more.

image

Really not sure what you are trying to achieve with this

The reality is that your model is just messed up and what you are attempting to do is never going to work

You need to optimize your model here, then what you are attempting to do will be seriously simple.

All I can recommend here is sort out your model via all the best practices mentioned in this course.

Starting here…

Sam

Hi,

I think I have now sorted my model based on your best practices in your videos. I have the water flow of my data in my tables through the filter tables to the fact table. What I’m not sure about is around the agreement which is my fact table but it’s also a filter table to my jobs as the service agreement can have many jobs, is this going to cause me problems when building a report?

Many Thanks for your help

Nathan
Power BI sample data.xlsx (632.0 KB) Power BI Sample.pbix (661.2 KB)

Ok great, it is looking ok. Still some improvements to go though. It’s still not right. You shouldn’t have any filter tables below your fact table.

The demo model you’ve included here has no relationships at all though so not sure what’s happened?

Also not sure why this is way over here??

Just make things easy on yourself.

It’s interesting when I started to bring it all together on the left-hand side the relationship all started appearing again.

You know what you need to do here to clean this up further is actually more work in the query editor. There’s lot’s more clean ups that can be done.

Here’s some examples.

Instead of having both these tables I’m just going to merge them as the groups table really has nothing substantial in it.

image

Now I can disable the load for this table into the model. Quick and easy clean up.

Same can be down in other tables as well. IndustryTypes, CustomerTypes

Potentially could also do customer table as well with a simple merge.

You see now I have these supporting tables in the query editor, but I don’t bring them into the model.

Look how much cleaner this already is

You probably would want to update names etc, but I’m just showing you some simple examples here.

I think you’re right around the filtering of the lower table here, but have a think around how you can clean this up further. I believe you can.

Potentially these two bottom ones? I’m not sure, you’ll know the data better than me.

Or does it make sense to create one master fact table by merging them all into this one larger table? Have a think about that. This could be a legitimate option.

Updates attached.
Power BI Sample.pbix (654.8 KB)

Thanks
Sam

Hi,

You have been a great help, there is clearly a big different between relational databases and Power BI models.

I have made the changes which I think should be enough to get me going. Can you take a look at 1 Measure in my report and advise how it could be achieved

as if I use all filter it also displays all the industry types instead of just the related.

Power BI Sample.pbix (646.0 KB)
Many Thanks Nathan

Ok cool,

So as you’ve place this formula in a different evaluation context, you need to adjust it slightly.

This is what I would do.

First I would take this out and create a separate measure for it.

image

Then add it back in here.

But honestly I’ve realized for this one you don’t even need anything around CALCULATE for this particular context below.

So just simplify things here as well.

This is all you need

I think a real deep dive in context here will help you understand more around what’s happening.

https://portal.enterprisedna.co/courses/108877/lectures/2000594

Sam

Thanks for that, I did add the ALL filter in but what I wasn’t doing was checking for if there was a blank first which upon testing was the reason why I had all the extra lines added.

There are however some blank values where there shouldn’t be, I’m not quite sure why as the industry type is Cafe and I need 91.15 to be displayed in every row.

One other thing I noticed was the totals were not correct, do you know why this would be?

Power BI Sample.pbix (646.3 KB)

Many Thanks,

Nathan

Getting totals right is all about understand the context of any calculating (especially when there is none, like with totals)

See here for a number of tutorials around how to solve for this.

Just think about what this part is doing when there is no context.

image

You need to somehow create an iterating function that works through each row and adds them all up.

The examples above give you a few examples of how to do this.

Sam

I found the measure that is adding blank values to KG’s Per M3 by Industry, but I’m unsure why. The calculation need to sum all the quantities if the service schedule doesnt have a valid to date.

2
please advise how I can fix this.

Many Thanks Nathan
Power BI Sample.pbix (656.5 KB)

Ive figured this out now, thanks for your help