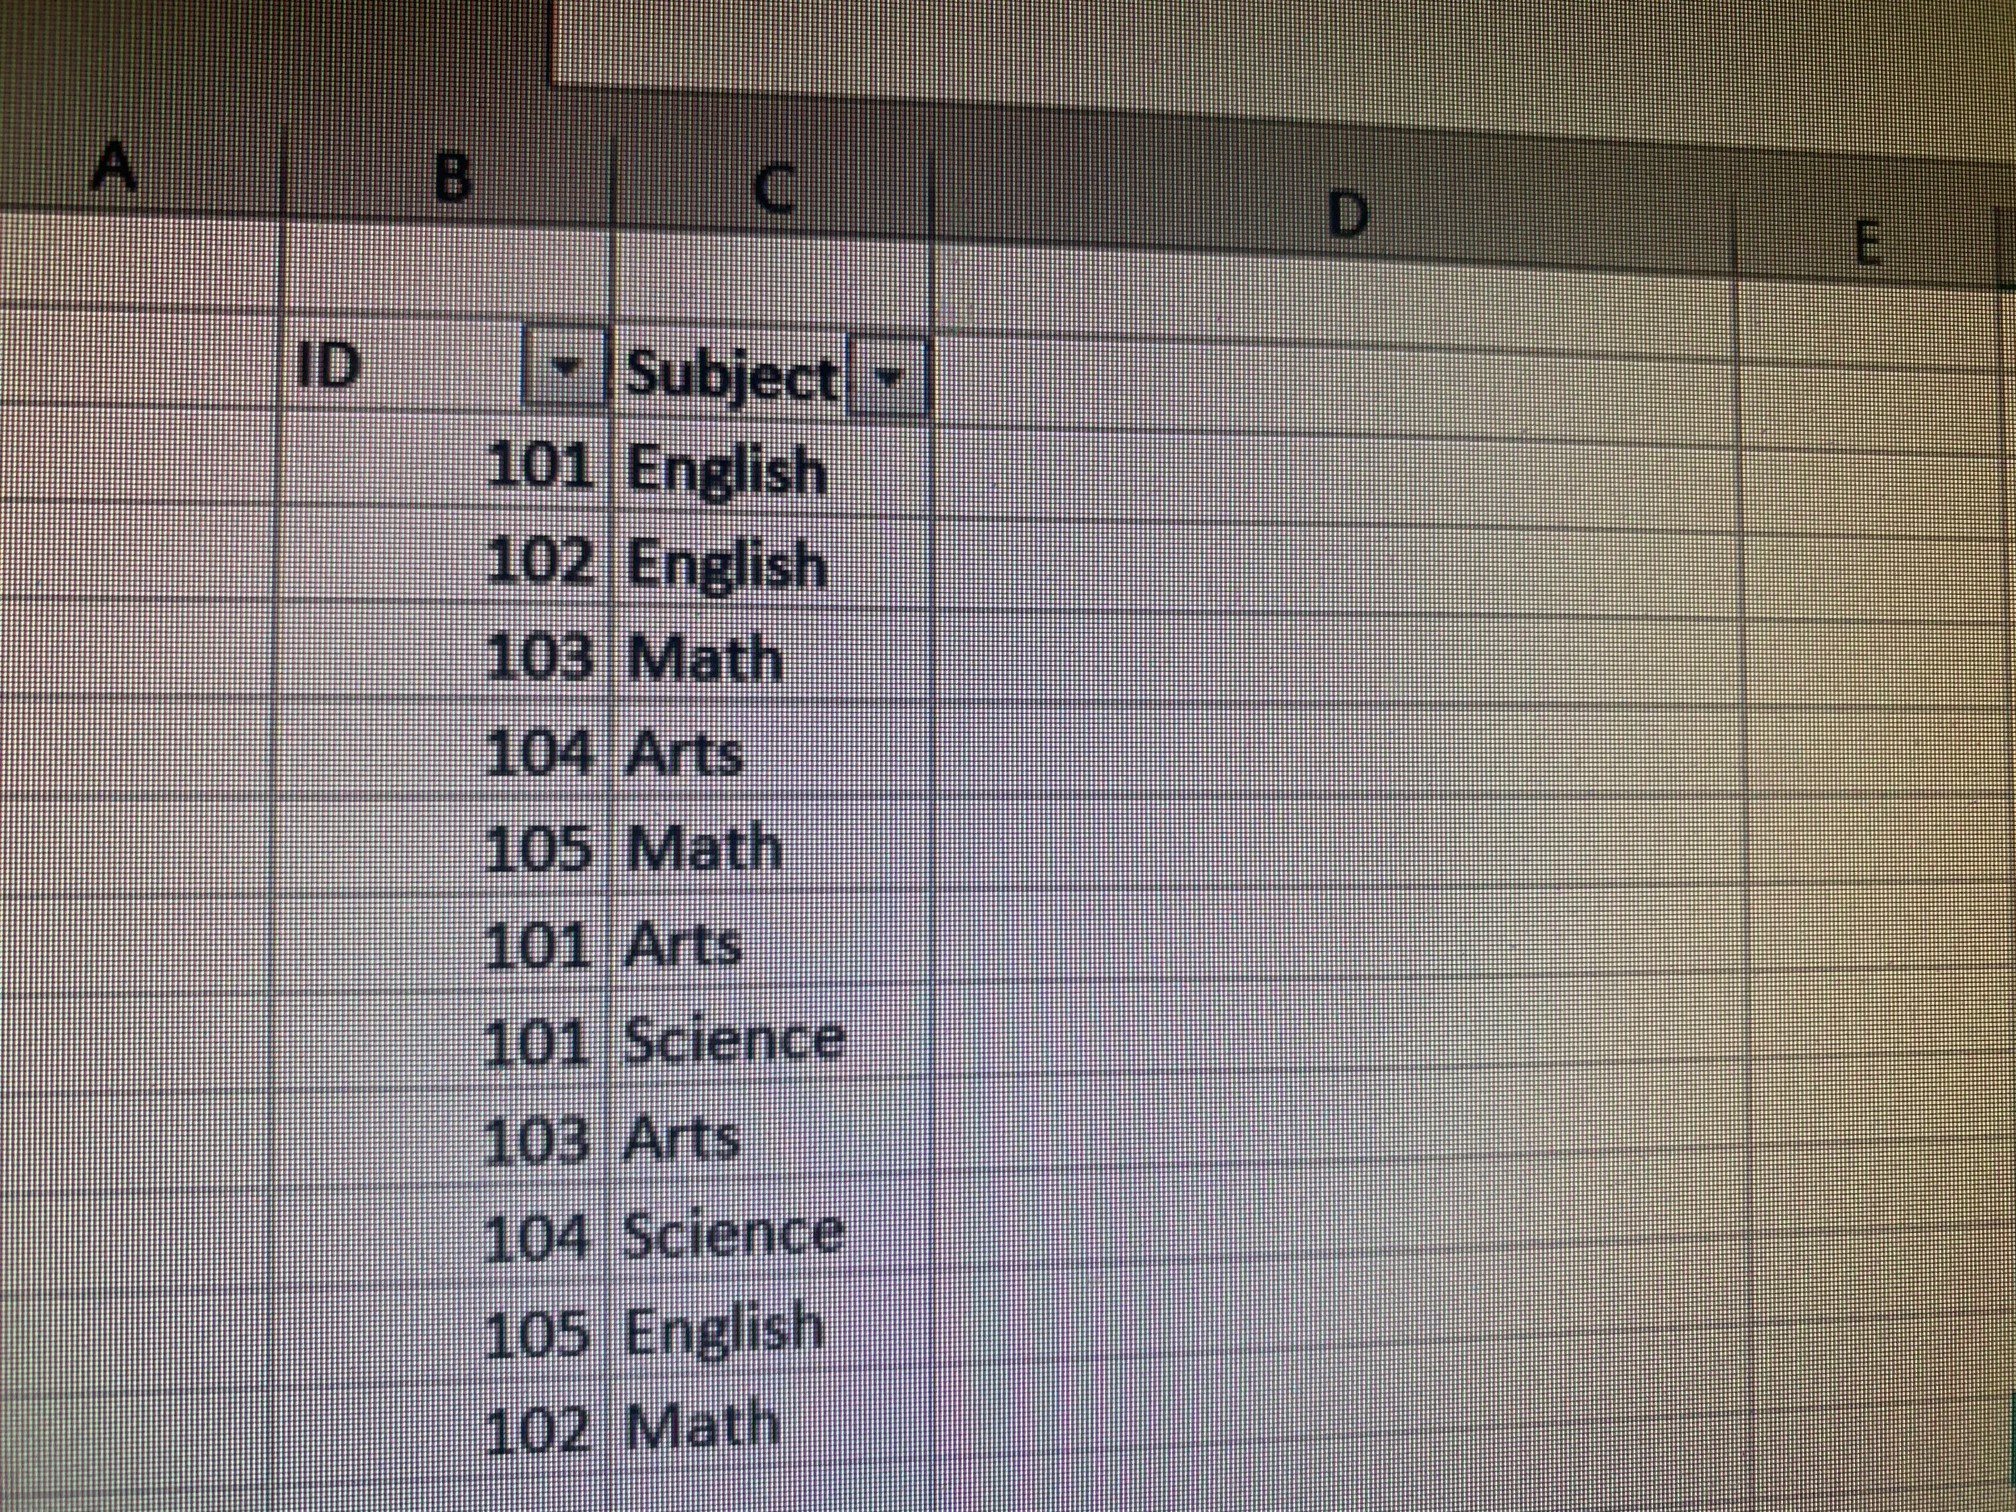
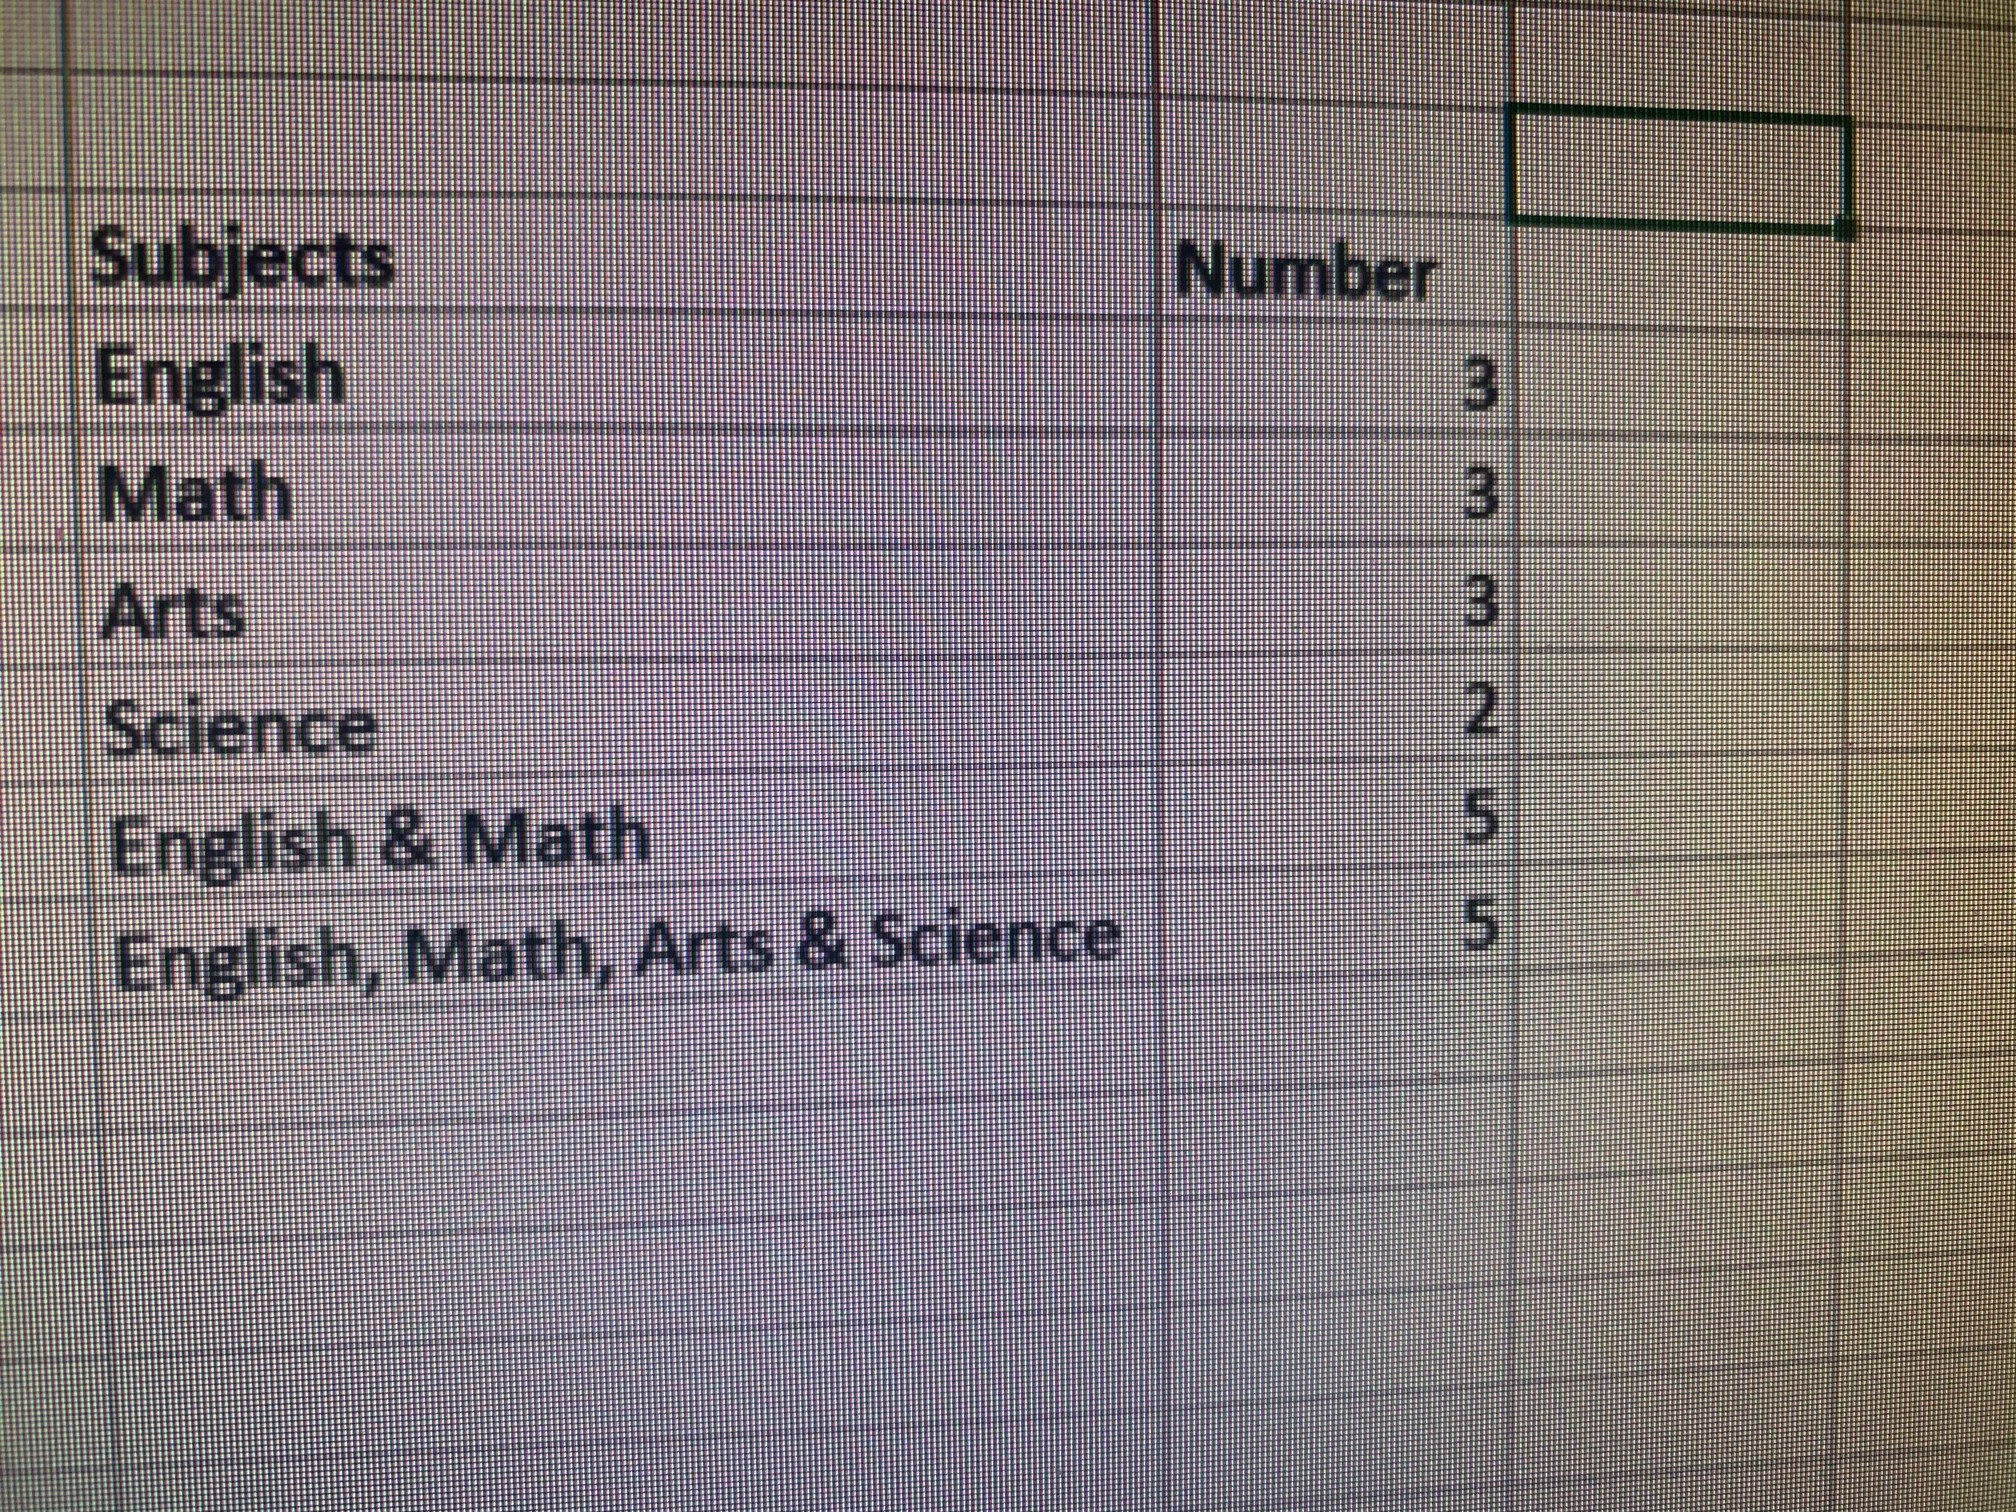
I thought of creating conditional columns to separate the group of subjects and then do an u pivot, however, my actual dataset size is huge and I am trying to see if there is a better way to do this. Please let me know.
Hi @supergallagher25, did the response provided by @Melissa help you solve your query? If not, how far did you get and what kind of help you need further? If yes, kindly mark the thread as solved. Thanks!
Hi @supergallagher25 , we’ve noticed that no response has been received from you since the 15th of December. We just want to check if you still need further help with this post? In case there won’t be any activity on it in the next few days, we’ll be tagging this post as Solved. If you have a follow question or concern related to this topic, please remove the Solution tag first by clicking the three dots beside Reply and then untick the checkbox. Thanks!
Hi @supergallagher25, a response on this post has been tagged as “Solution”. If you have a follow question or concern related to this topic, please remove the Solution tag first by clicking the three dots beside Reply and then untick the check box. Also, we’ve recently launched the Enterprise DNA Forum User Experience Survey, please feel free to answer it and give your insights on how we can further improve the Support forum. Thanks!