Hi All,
I had my solution for benefits investigation at this link. I am trying further calculations to aggregate the values from measure by ranges.
I know its really simple, something related to SUM but I cannot figure it out. Below is the screenshot for calculation that I achieved in excel by using pivot table
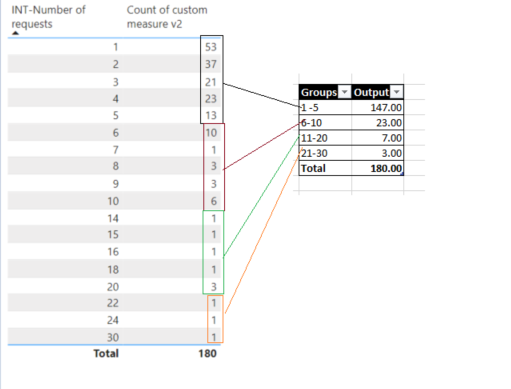
This screen shot is just an example that i was experimenting . Original ranges will be 1-20, 21-30, 31-40 and 50+
This is the link for PBIX file Test(6)
