Hi @PranjaliK,
Welcome to the forum!
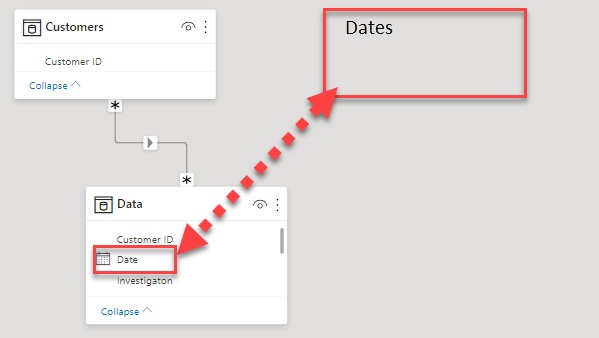
Currently you are working with a flat file, I’ve added a Customers dimension table (currently this has a M:M relationship due to the fact that it contains blanks). Since you also have a Date column I recommend you add a Date dimension as well, you can find an extensive date table here.

.
Next I created some measures:
Number of requests by customer v2 =
 COUNTROWS (
        FILTER (
            ALLSELECTED ('Data' ),
           'Data'[Customer ID] IN VALUES( Customers[Customer ID] )
        )
    )
.
Count of custom measure v2 =
VAR vTable =
    ADDCOLUMNS(
        VALUES( Customers[Customer ID] ),
        "No Requests", [Number of requests by customer v2]
    )
RETURN
    COUNTROWS(
        FILTER( vTable,
            COUNTROWS(
                FILTER(
                    Table1,
                    [No Requests] = [INT]
                )
            ) >0
        )
    )
.
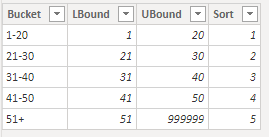
Next I added a supporting table to your model.

and this final measure
Grouping measure v2 =
VAR vTable =
    ADDCOLUMNS(
        VALUES( Table1[INT] ),
        "QTY", [Count of custom measure v2]
    )
RETURN

    COUNTROWS(
        FILTER( vTable,
            COUNTROWS(
                FILTER(
                    Segments,
                    [QTY] >= Segments[LBound] &&
                    [QTY] <= Segments[UBound]
                )
            ) >0
        )
    )
.
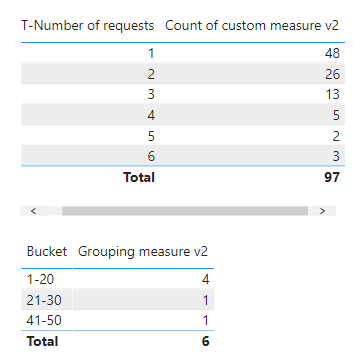
With this result

Here’s your sample file.
test (6).pbix (296.7 KB)
I hope this is helpful