Hi there, I hope everybody is doing great.
I’ve been trying to crack this nut for some hours, but I’m not finding the right way to do it - so I rather ask for help.
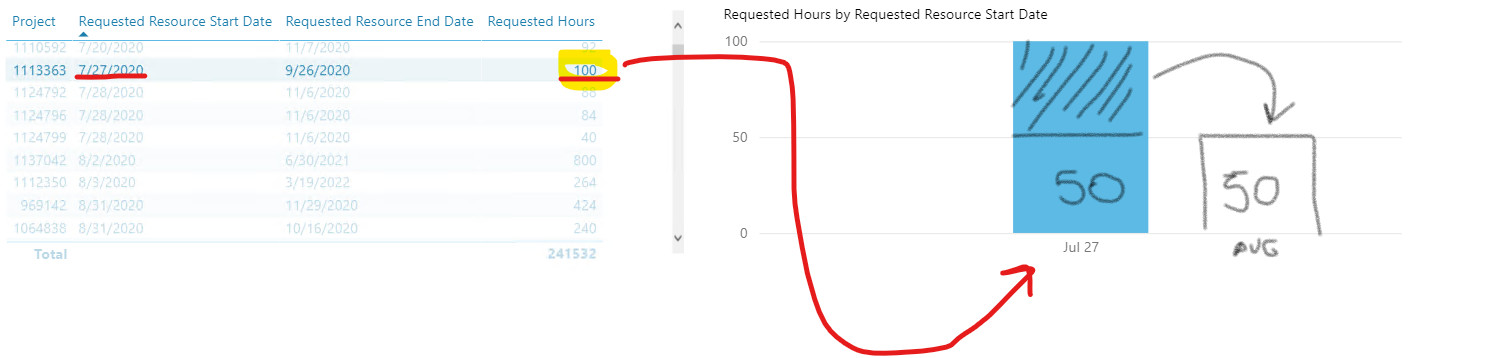
the situation is simple - I have projects that have start and end dates , total requested hours and I want to be able to spread the requested hours over the months since the project start till it ends.
For example a project that has 100hrs requested over two months , I want to be able to put that into a visual but instead of seeing 100hrs on the starting date of the project , I want to be able to see 50 hrs on month 1 and 50 hrs on month 2. - if the project runs for 10 months and its a 1000 hrs project , then I want to be able to see 100 hrs x month over the 10 months of the project.
Unfortunately there’s no granularity on the data I’m getting and I don’t know how create that table .
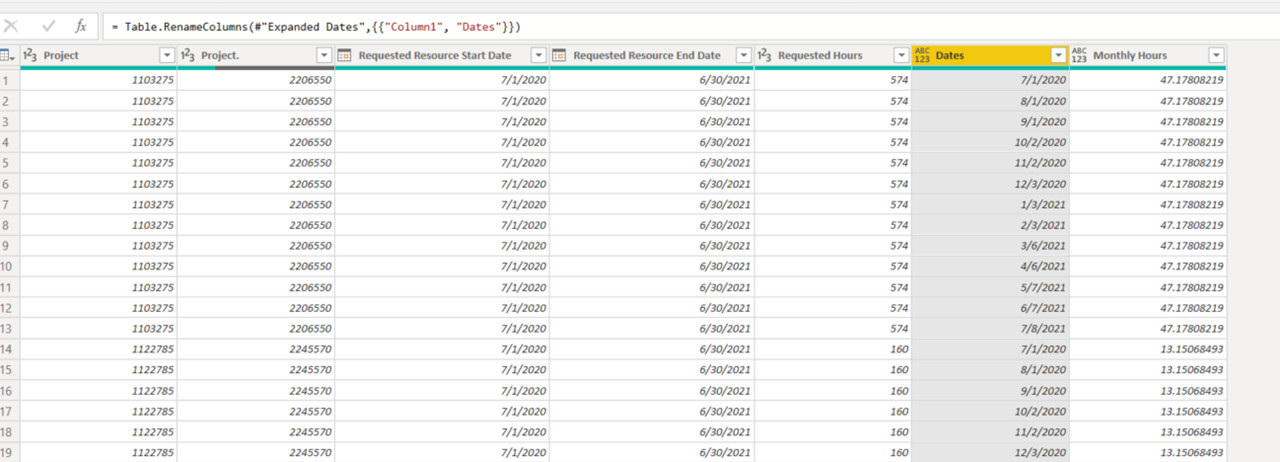
I’m attaching a picture of the issue (not the solution but I hope the explanation makes it easy to follow). and adding a simple table with the minimum data I guess we need to create a solution (the model is way to big and sensitive to share more than this).
thanks in advance
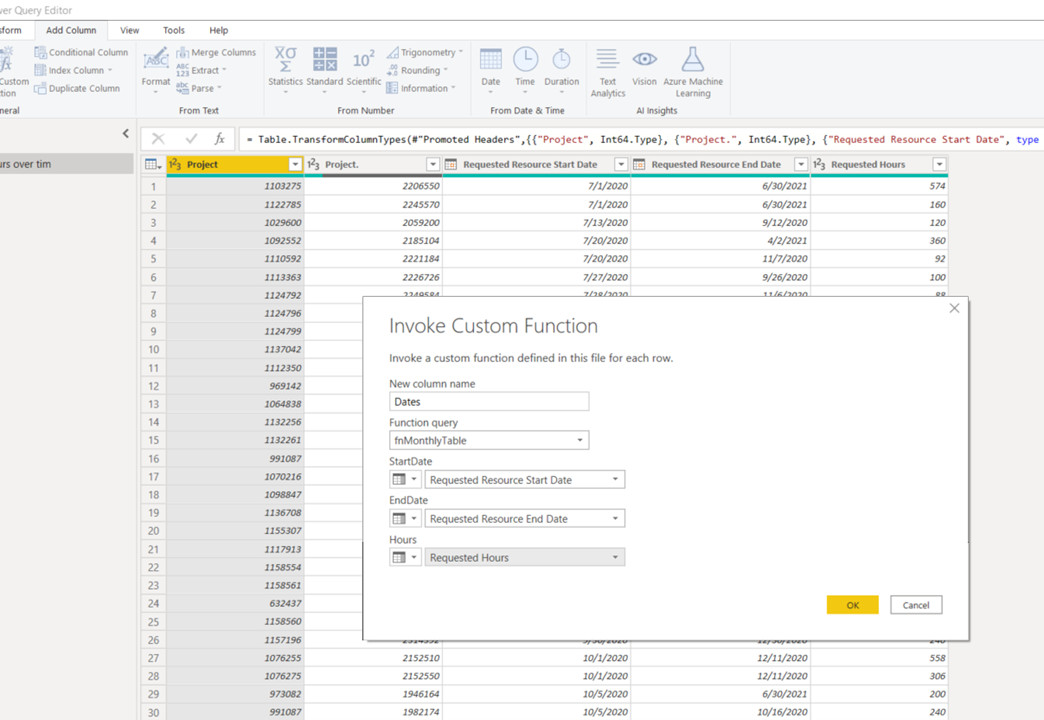
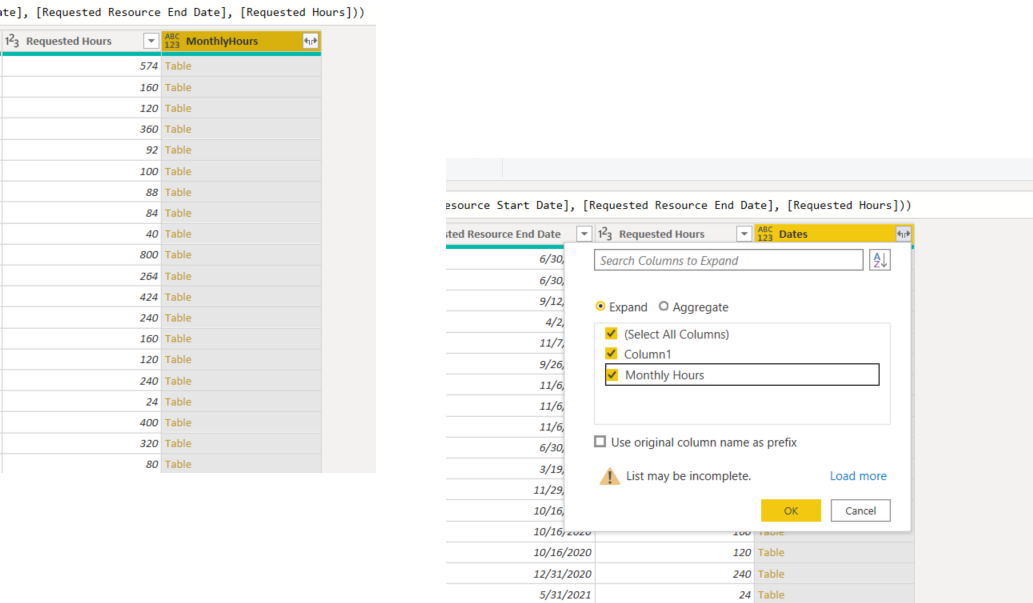
I created a PowerQuery function (M) fnMonthlyTable to help you address this:
let fnMonthlyTable = (StartDate as date, EndDate as date, Hours as number) as table =>
let
    _Months = (Duration.Days(EndDate - StartDate) + 1)/30,
    _MontlyHours = Hours / _Months,
    _Period = List.Dates(StartDate, _Months, #duration(31,0,0,0)),
    TableFromList = Table.FromList(_Period,Splitter.SplitByNothing()),
    AddMonthlyHour = Table.AddColumn(TableFromList,"Monthly Hours", each _MontlyHours, type number)
in
    AddMonthlyHour
    in
    fnMonthlyTable
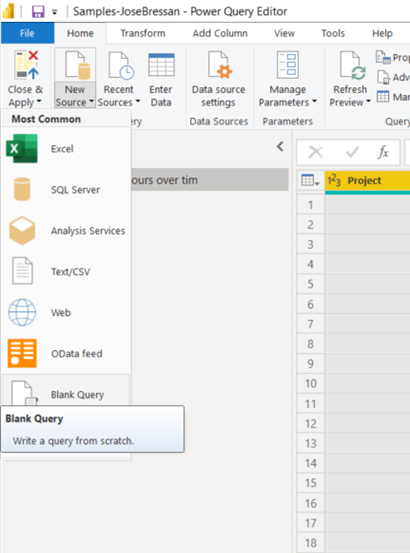
Create a New Blank Query and edit with advance editor (Paste the code)
this is genius thank you Jbressan!!! - although I have an issue when I do this on the production file which has more columns. when I look at the query editor I see the 3 new columns working just fine - but when I hit close and apply I get this weird message
Sounds like a data issue … perhaps one or more records has a NULL value for StartDate or EndDate? If so, then just filter-out those record(s) or do a NULL check before using the data values.
Greg
Indeed it was a null but not in the date column , was in the requested hours column which is part of the calculated column formula.
thank you so much for the help. this is an awesome forum to post very difficult questions - I’m amazed!
BTW: where can I go and learn to write these specific type of functions/formulas ? I mean that’s not DAX - any recommendations?
This is M code, one of the most powerful and yet least discussed elements of Power BI. We are incredibly fortunate on this forum to have Enterprise DNA Expert @Melissa, who is a world-class expert in this area. 98% of what I know about M code has come from her videos that @jbressan recommends above and also from studying her forum posts, where she often provides detailed breakdowns of her solutions that are mini-master classes on Power Query and M coding.
When I asked her how she learned this, she pointed me to these resources:
but honestly I don’t think any of them are as good a learning resource as her videos and posts. Developing a basic proficiency in M has transformed the way I use Power BI, now relying much more heavily on the data prep and data modeling phases to carry the load in my reports, improving performance and simplifying my DAX. A great example of this is Problem of the Week #4 – in the past, I would have dealt with the granularity mismatch using fairly complex DAX in conjunction with TREATAS to allocate my monthly data down to the daily level, now I just do it straight in Power Query, making the remaining DAX trivial.
As part of our major platform course emphasis this year, @Melissa will be initiating the most comprehensive course series anywhere on Power Query/M. This is a massive, multiyear undertaking but will guide users from the very basics of Power Query through advanced M coding. We anticipate rolling out the first course in this series later this Spring.
So that’s a (very) long answer to your question, but hopefully encourages you and others to begin to delve into this underemphasized but amazing aspect of Power BI. Personally, I find M code programming really enjoyable – there are over 700 separate M functions (more than 5x the number of DAX functions), so much of M coding is what Melissa calls “learn by Googling”– basically figuring out what you want M to do conceptually with your data, and then going on a scavenger hunt to find the function(s) that does that – a very different experience than writing DAX.
Hi @dsiffredi , did the response provided by the users and experts help you solve your query? If not, how far did you get and what kind of help you need further? If yes, kindly mark as solution the answer that solved your query. Thanks!
Hi @dsiffredi, we’ve noticed that no response has been received from you since the 26th of February. We just want to check if you still need further help with this post? In case there won’t be any activity on it in the next few days, we’ll be tagging this post as Solved.
Hi @dsiffredi, a response on this post has been tagged as “Solution”. If you have a follow question or concern related to this topic, please remove the Solution tag first by clicking the three dots beside Reply and then untick the check box.
We’ve recently launched the Enterprise DNA Forum User Experience Survey, please feel free to answer it and give your insights on how we can further improve the Support forum. Thanks!