Good morning,
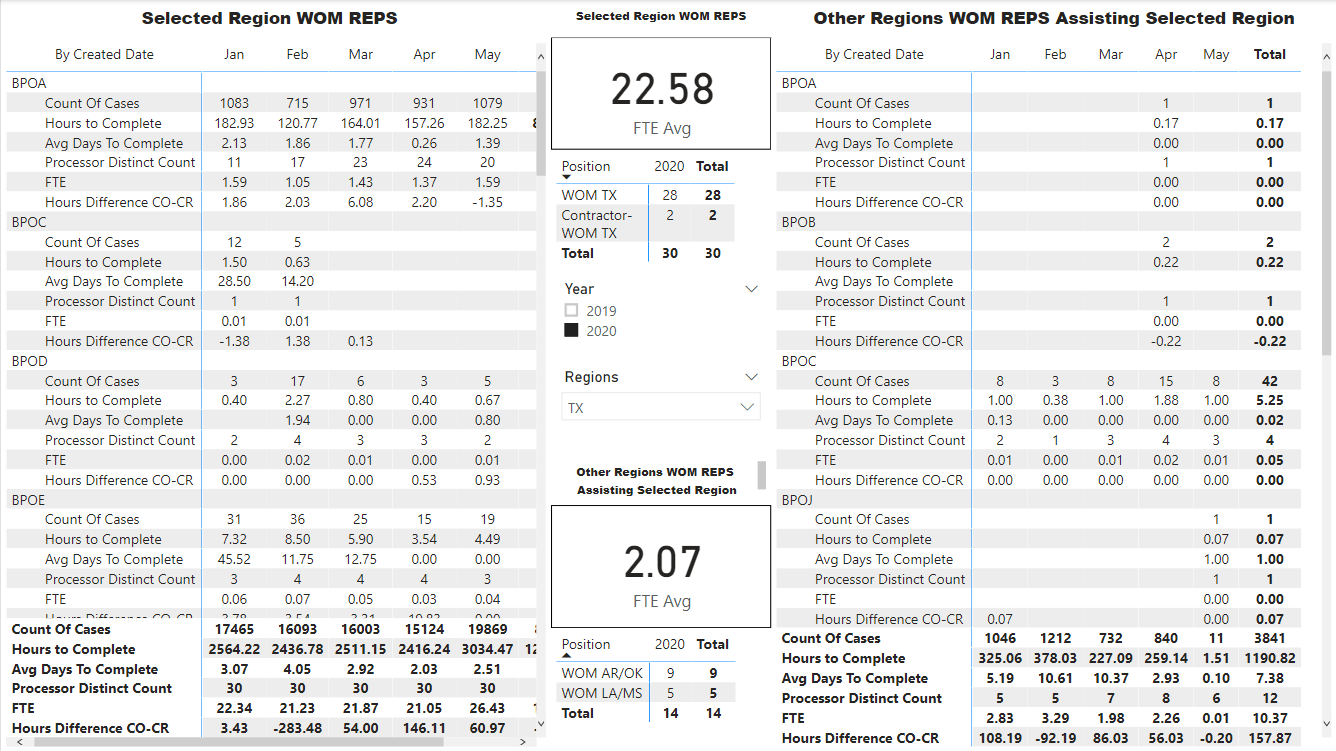
I have a scenario I am trying to work through. We have a slicer that list 4 different regions. I want to be able to select one region, 3 of the visuals (Matrix, Card and another Matrix) will display the results completed by reps from that region. The other 3 visuals (same as other visuals) will displays the results of reps from other regions that completed work in the selected region.
I currently set visual level filters to get the desired results. Which will need to be manually adjusted for each region. With 6 pages and 6 visuals per page can get time consuming.
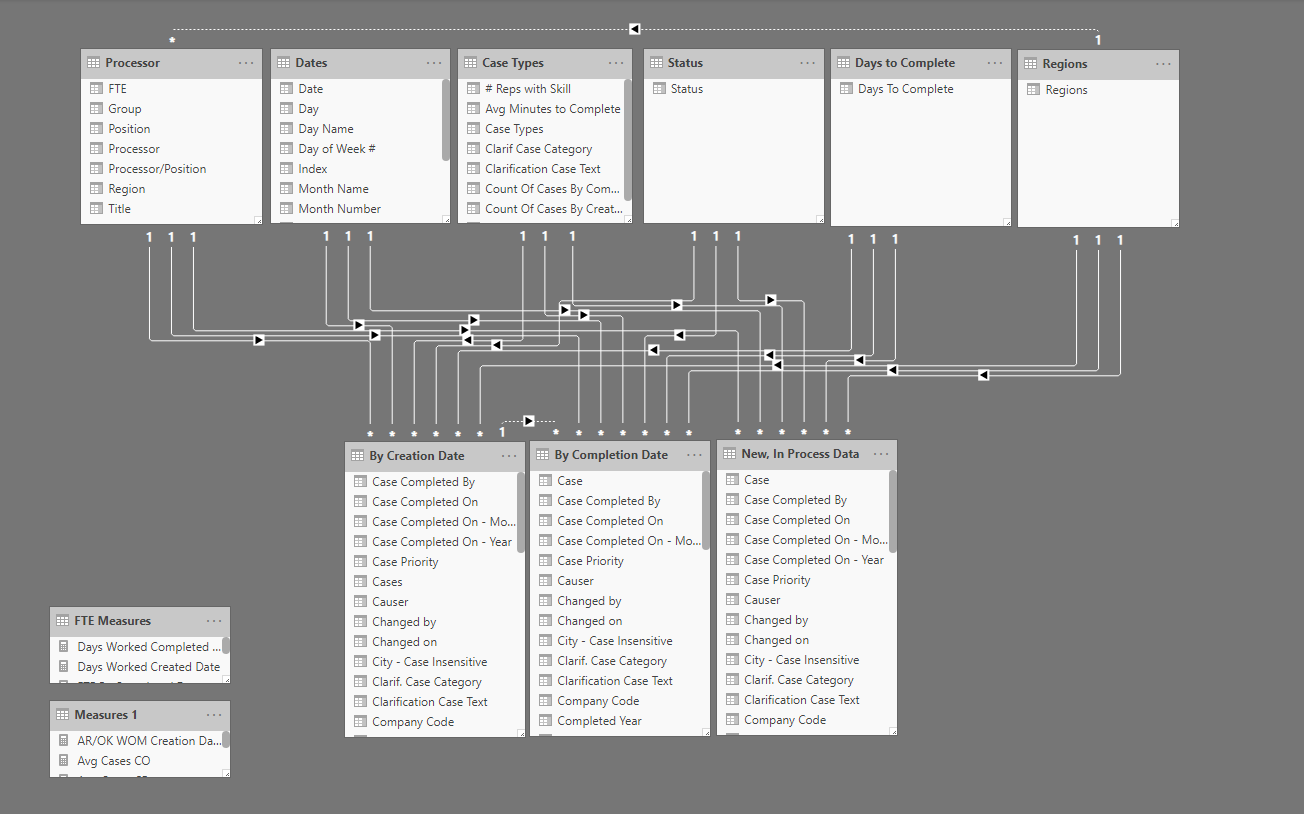
Relationships
Measures used in the Visuals.
- FTE By Created Date = CALCULATE([Hours By Creation Date]/20.5/5.6)
- Count of Cases Creation Date = COUNT(‘By Creation Date’[Cases])
- Hours By Creation Date = [Minutes by Creation date]/60
- Hours Difference CO-CR = [Hours By Completion Date]-[Hours By Creation Date]
- Processor DCount By Creation Date = DISTINCTCOUNT(‘By Creation Date’[Processor])
- FTE By Created Date Avg = ‘FTE Measures’[FTE By Created Date]/[Count of Months (CR)]
I have looked at the Bookmark angle. I would prefer to do it on the DAX level. Any help on this would be greatly appreciated.

