I created a report to show Rolling 12 months CY, PY using SAMEPERIODLASTYEAR DAX as shown for example;
NewIntake = SUM(‘Customer Service Center Metrics’[New])
Previous = CALCULATE(‘Customer Service Center Metrics’[NewIntake],SAMEPERIODLASTYEAR(‘Date2’[Date]))
I am using Relative date in the filter section to limit it to show values in the last 12 month which gives me my 12 month each time a new month is uploaded. This works fine but I am not able to make the X-Axis show Short-Month (Jan, Feb etc.).
I would appreciate help in figuring out what am doing wrong and any suggestion to what solution will work for me.
Hi @Eliezer20101980, Ihope that you are having a great experience using the Support Forum so far. We’ve recently launched the Enterprise DNA Forum User Experience Survey, please feel free to answer it and give your insights on how we can further improve the Support forum. Thanks!
Thank you @Melissa
I added the Month short attribute in my Date table and am still not getting the desired result. I have attached the PBIX File for a more detailed view of the dataset. I also created a another Date Table using the M Query you put up in your reply.
Thank You for posting your query onto the Forum and for providing the working of the PBIX file.
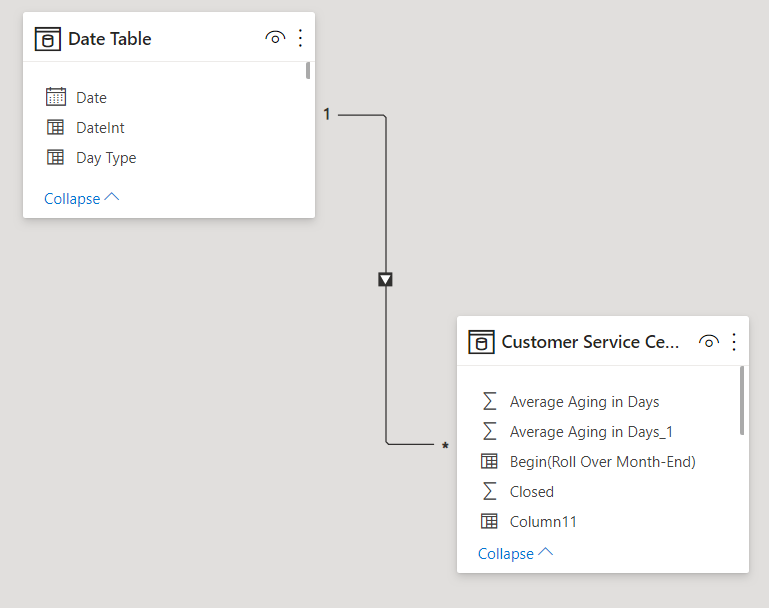
Now, I removed the old Date table and retained the new Date table which you’ve added into your model using @Melissa’s M code. So I observed that there was a bi-directional filter between the Fact and Dimension table which has been converted to the uni-directional flowing from “Date” table to “Customer Service Center Metrics” table. Below is the article provided for the reference about “Why Bi-Directional Filter Is Not Recommended?”
Now, corrected the formula for “Avg Aging Days PY” since it was referencing the old date table. Below is the revised formula provided for the reference -
Avg Aging Days PY =
CALCULATE( SUM( 'Customer Service Center Metrics'[Average Aging in Days] ) ,
    SAMEPERIODLASTYEAR( 'Date Table'[Date] ) )
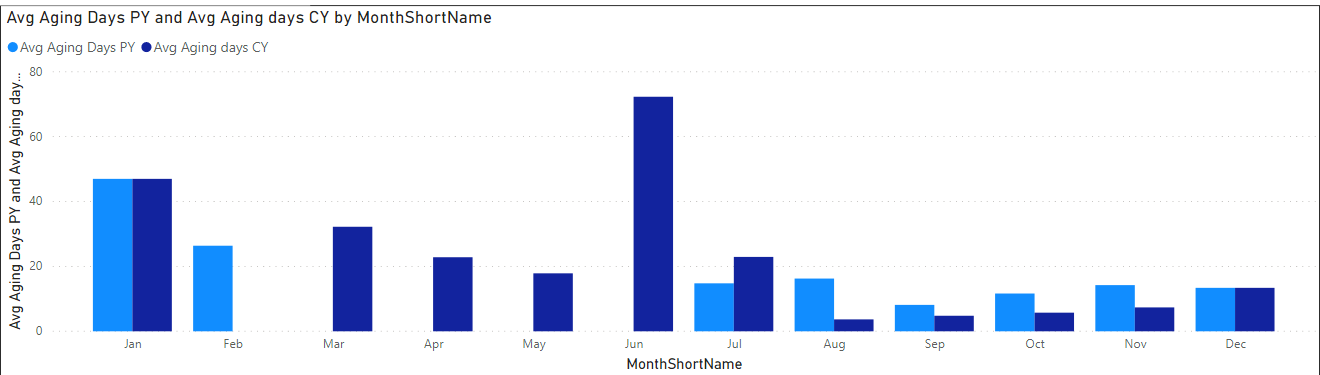
Now, drag the “MonthShortName” into the Bar Chart and sort it using the “MonthOfYear” column. So that short month name are properly arranged in the month order.
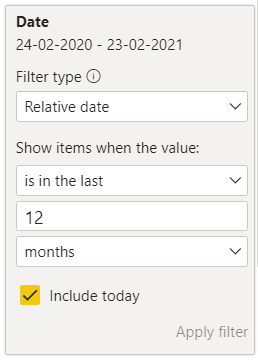
And lastly, add the “Date” column into the FILTER PANE and select the option as “Relative Date”. Below is the screenshot provided for the reference -
And now, you’ll have the chart showing the last 12 months with the short month name. Below is the screenshot provided for the reference -
@Harsh. Thank you so much for helping me understand the bi-directional filter and resolving this for me. I have gain more knowledge in what would help me for the future on the need for a good date table.
Hi @Eliezer20101980, did the response provided by @Harsh and @Melissa help you solve your query? If not, how far did you get and what kind of help you need further? If yes, kindly mark as solution the answer that solved your query. Thanks!
Hello @EnterpriseDNA, Yes the response provided by @Harsh and @Melissa helped me solve my query. I have marked as solution the answer that helped to solve my query.
@Harsh , @Melissa and @EnterpriseDNA . Is there a way to have the legend show the years only with same color for the bars for Current year and Previous Year ?
I have an attachment screen shot example of what am referring to.
Thank you @Harsh. I will create a new post. Meanwhile this Query is a continuation of the original solution so should I attach the files from the last one to the new query?