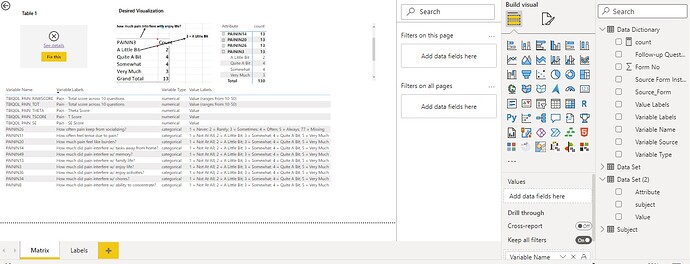
I have my raw data and data dictionary in two separate files (included here in one Excel file under separate Tabs) and structure. The raw data has a regular/normal structure with variables on the column and subjects on the rows. However, the data dictionary file includes a list of variables on rows under one column (Variable Names) followed by corresponding columns that describe each variable such as variable labels, value labels, variable type, etc. Since the two structures are different, I can’t connect the two tables to bring variable characteristics from Data Dictionary to any visualizations created via the raw data set. The only option, to my knowledge, is to Unpivot the raw data set so all variables are listed under one column then I can join the two tables as 1 to many relationships. Since the raw data set contains 5000 rows and more than 800 variables, Unpivoting the data set creates millions of rows and not an efficient solution. The desired outcome, indicated in Power BI example (included), is when I hover over a variable in the Matrix, or in any other visualizations, I like to see its labels and all other information existed in the corresponding rows of data dictionary. Any guidance is greatly appreciated.
Thank you,
Helal
Data and Labels.pbix (68.6 KB)
Data and Labels.xlsx (21.5 KB)
