Hi everyone, new user here, and I am hoping to get some tips on setting up financial data for analysis. I have watched the videos and topics posted on the forum and related videos in the financial modeling course.
I imagine I am not the only one that gets really messy data from ERP software. In the financial modeling course, the source data from excel is very clean with Indexes (customer, order #, etc.) that can easily be linked to each other. I have the opposite problem - I get sales data with 50 columns, 10K+ rows, and no indexes to match anything.
Is there a specific video that shows you how to set up data using index #'s to link everything? Should this be done in excel first before uploading to power bi (e.g., create a customer + index table and then match it in excel).
I see a few different ways to do it, but hopefully there is a video or someone on here that does this often that can show me how to quickly streamline this process.
Thanks!
@Azazello,
Welcome to the forum. I’ve done this for several of my clients, and very familiar with Sam’s techniques in accomplishing this. The best content on this topic is found in the financial modeling portion of the portal. You can do this in excel, or inside of Power BI. If you post a sample version of your excel data model, it might be a little bit easier to suggest how to proceed. If you don’t feel comfortable sharing your complete model, just share the names of all of your columns and a small portion of the data.
Thanks
Jarrett
Thanks Jarrett.See below (blinded customer names)
Sales by customer by SKU.xlsx (13.1 KB)
The way I would set this up would be to create a new tab in excel that is a customer index by name and then use an IF statement or an INDEX(MATCH
| Index |
Customer |
| 1 |
Customer A |
| 2 |
Customer B |
| 3 |
Customer C |
| 4 |
Customer D |
| 5 |
Customer E |
| 6 |
Customer F |
How would you do it? Do you add an index for every table?
@Azazello,
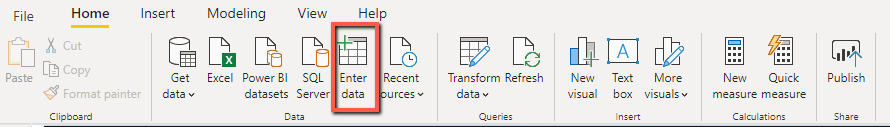
If you already have “Customer” in each of you tables, there is no need to do this in Excel. Just click on “Enter Data” at the top left of the screen, and enter the Index & Customer information manually.
Here is a photo of where to click if you are not aware:
If you have any issues once you get everything uploaded to Power BI, let us know and we would be glad to help.
One other tip when replying to a response. Make sure you click on the reply button to ensure that the person responds in a timely manner:
Thanks
Jarrett
Thanks for the reply tip. I’m confused about what you mean enter it manually. From my count, I believe I have ~1,800 unique customers.
@Azazello,
With the data I saw I didn’t see that many  . In that case just enter the information once on an excel tab, and bring it into the Power BI model by itself.
Thanks
Jarrett
Instead of typing and if you already have it in Excel you can also copy and paste it in the “Enter data” window as long as you aren’t pasting more than 3000 “cells” ( I believe ).
Alternatively you can also get your fact table into Power Query.
Right click on the Column header with your Customer names and select “Add as New Query”
On the Home tab select “Remove Rows”, “Remove Duplicates” and
On the Add Column tab select “Index Column”, “From 1”
That way new clients will automatically be assigned an Index number BUT the same is true if there’s a typo in the Customer name of course… with a bit of work you can have PQ check for that as well
1 Like
fantastic 
Really appreciate the help!
Great! I just gave this a shot on a subset of the spreadsheet and it was super easy.
1 Like