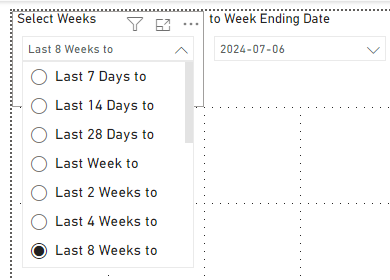
I wish to have a Slicer or Slicers that allow me to Select N Weeks to a Selected Week End Date when I have more than 1 Fact
Week End Date table joined 2 Facts on Week End Date

Now I want to add Measures from each Fact Table and display on a common Chart with Week End Date on the X Axis
I cant see how to do this without a Bridge table
Any ideas
Thanks - but I already knew that - I want to be able to Select the End Date - not N Weeks to Today but N Weeks to a Selected End Date
Which I can get to work if its just 1 Fact
CALCULATE
-
(*
-
SUM('Fact_Finance_Payroll'[Payroll_Hour_Amount]),*
-
DATESINPERIOD('Dim_Common_Week'[Week_End_Date],MAX('Dim_Common_Week'[Week_End_Date]), *
-
MAX('Dim_Select_Period_Range'[Range_Difference_Number]) * 7, DAY)*
-
)*
Because you can just use the Week End Date from the Fact in the Chart
The trouble is when there are 2 Facts
This is straight forward if its just Select N Weeks to TODAY()
Custom Range Date Slicer in Power BI with dynamic defaults and more…
Because it uses the Week Dim – but I cant get this to use a Selected Date – i.e. I cannot get _today = The Selected Week End Date
PromptPeriodRangeTable =
VAR _datetable = Dim_Common_Week_Prompt
VAR _today = TODAY()
RETURN UNION
(
ADDCOLUMNS(FILTER(_datetable, [Week_End_Date] > _today - 28), “Period”, “Last 4 Weeks”, “Order”, 1),
ADDCOLUMNS(FILTER(_datetable, [Week_End_Date] > _today - 56), “Period”, “Last 8 Weeks”, “Order”, 2),
ADDCOLUMNS(_datetable, “Period”, “Custom…”, “Order”, 9)
)
