Scenarios Analysis Distinct

Practice model - Scenario Analysis.pbix (496.9 KB) Retail Sites - Data Model.xlsx (2.3 MB) Scenario Analysis.pbix (546.6 KB)

Hey,

I run into a small issue while working on the course on Enterprise DNA.

I noticed that data that is used by Sam and what is available is slightly different. Currently, I am on “Project numbers forwards using new tables of data” I wrote exactly the same formula as Sam but the Distinct code did not remove blanks data as it supposes to.

Also while comparing data Sam did receive answers to 101 products whereas my data includes 30 products. I did review the Excel file via the pivot table and my answer is correct.

I wonder why the distinct did not work as it supposes to and why the data is different?

Hello @Matty,

Thank you for posting your query onto the Forum.

Firstly as said mentioned about your calculations, yes they’re absolutely fine.

Now, as you mentioned about “I wonder why the distinct did not work as it supposes to

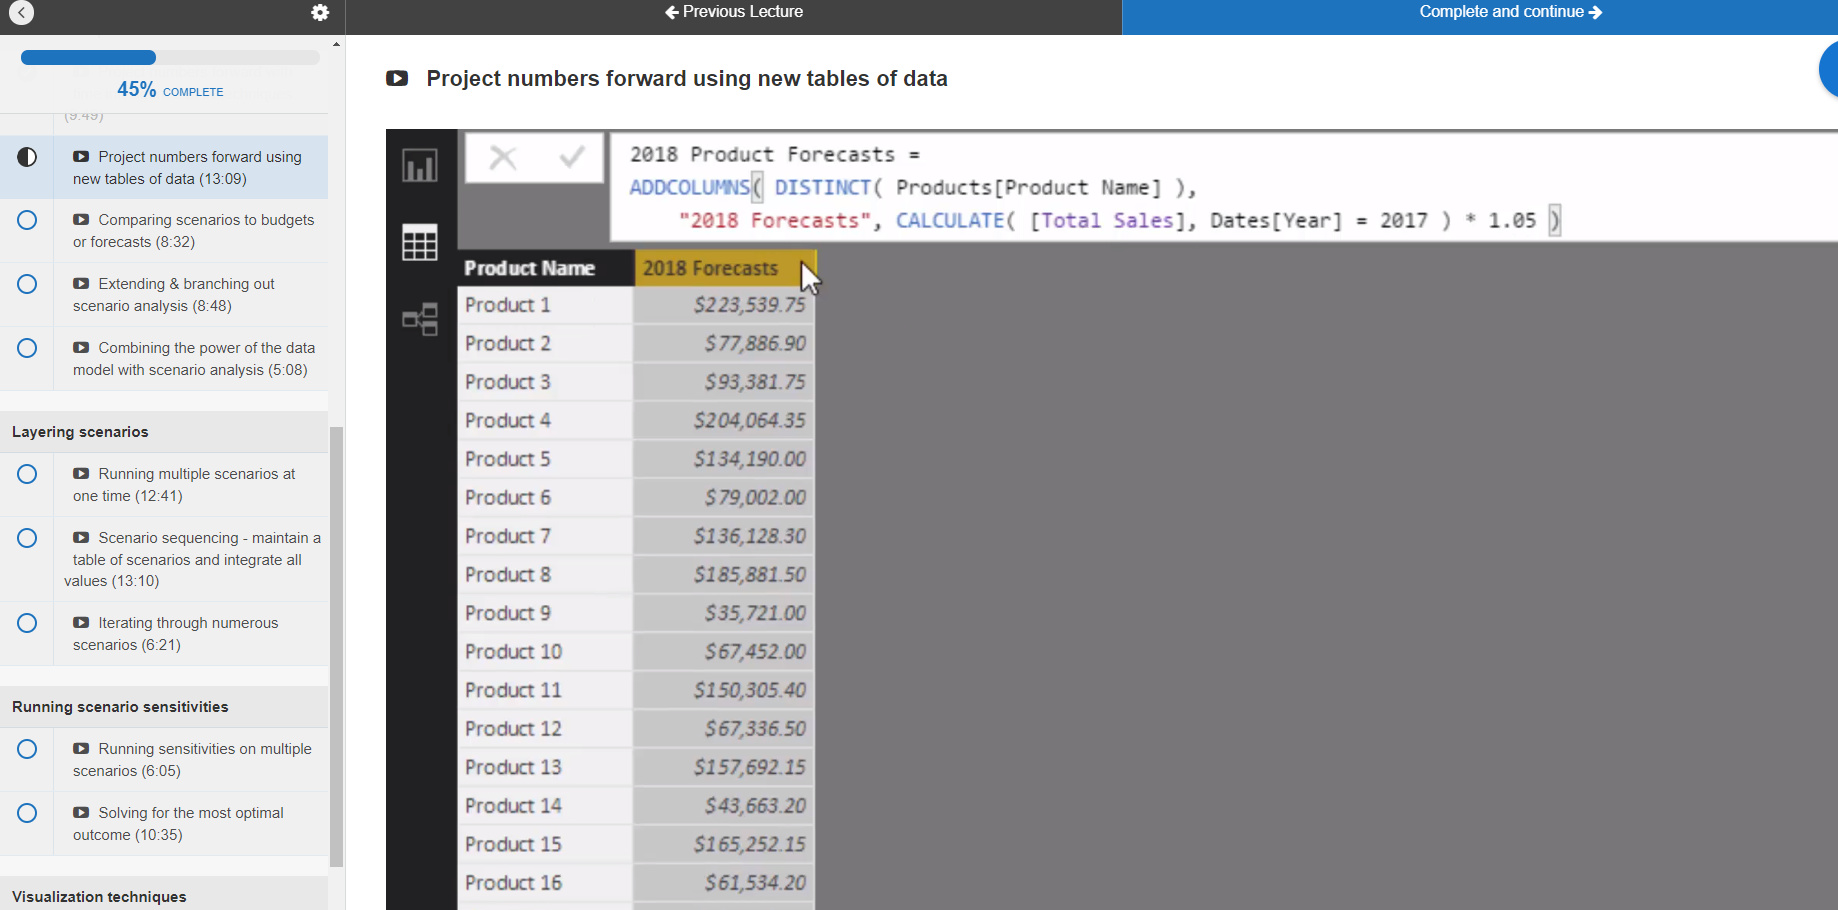
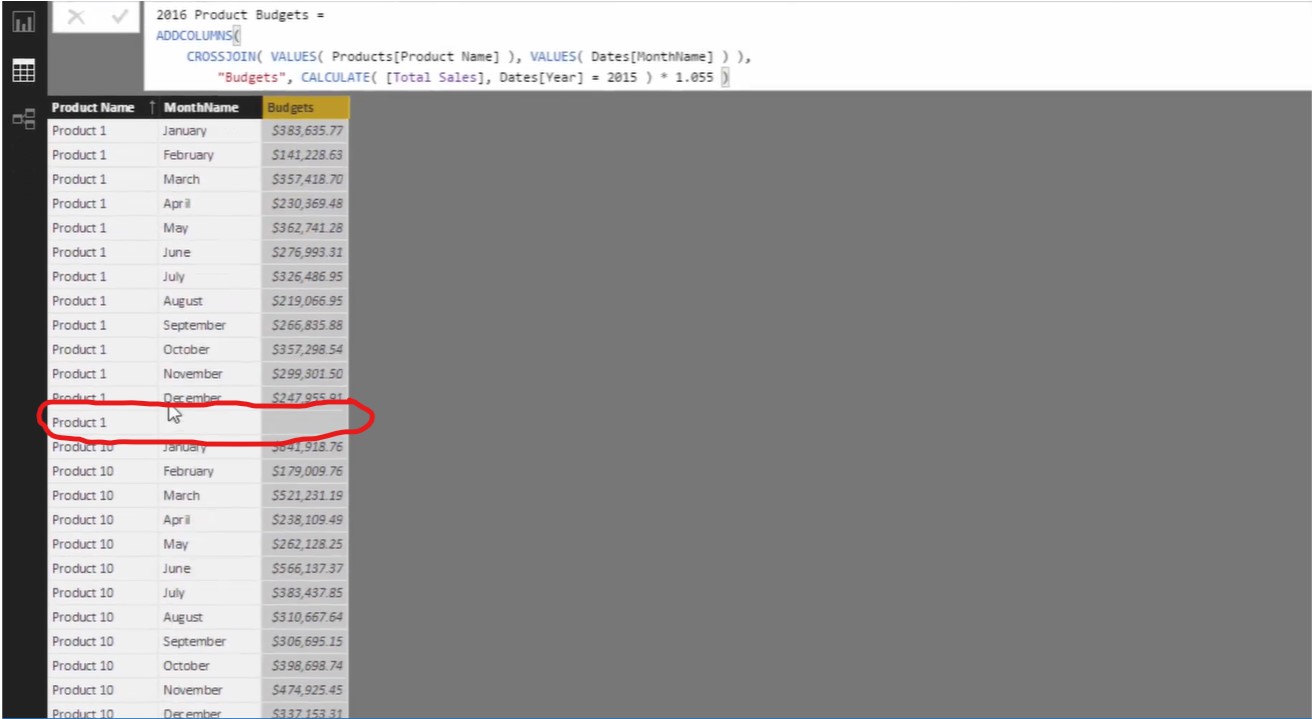
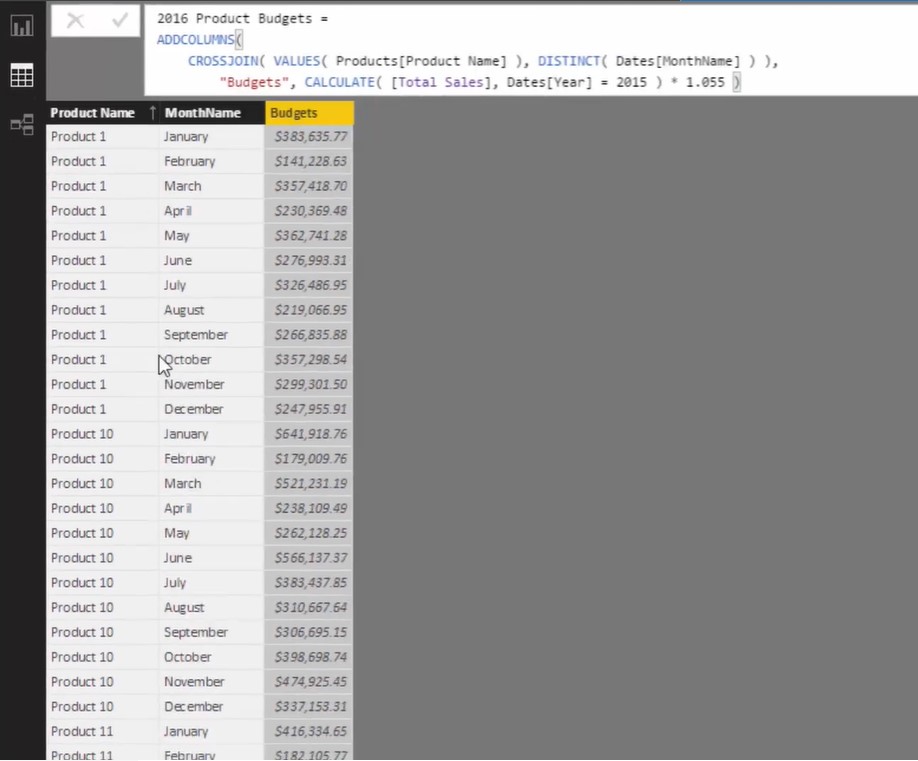
The DISTINCT() function has worked correctly since it’s known for providing a unique list of values which we’ve already received in this case. Now, against the Product Name it’s showing you blank because against those Products there’s no Sales record for the Year = 2017 and now if we try to project/forecast against those we are by default gonna going to receive Blank values.

Distinct function removes the Blank values which are there within the column and not the adjacent to it.

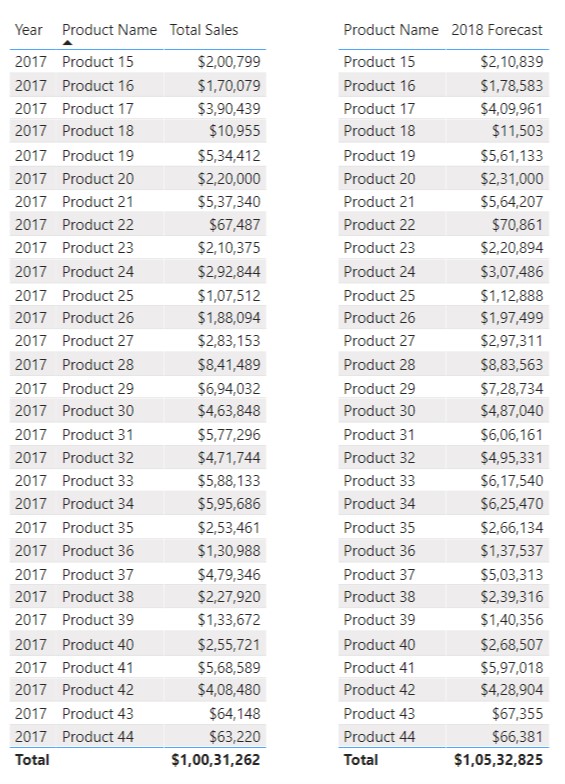
So now when I compare my Year = 2017 records of Sales data with records of Year = 2018 we are getting the correct results in the visuals since there’s no data against the remaining products. I’m attaching the below screenshot for the reference.

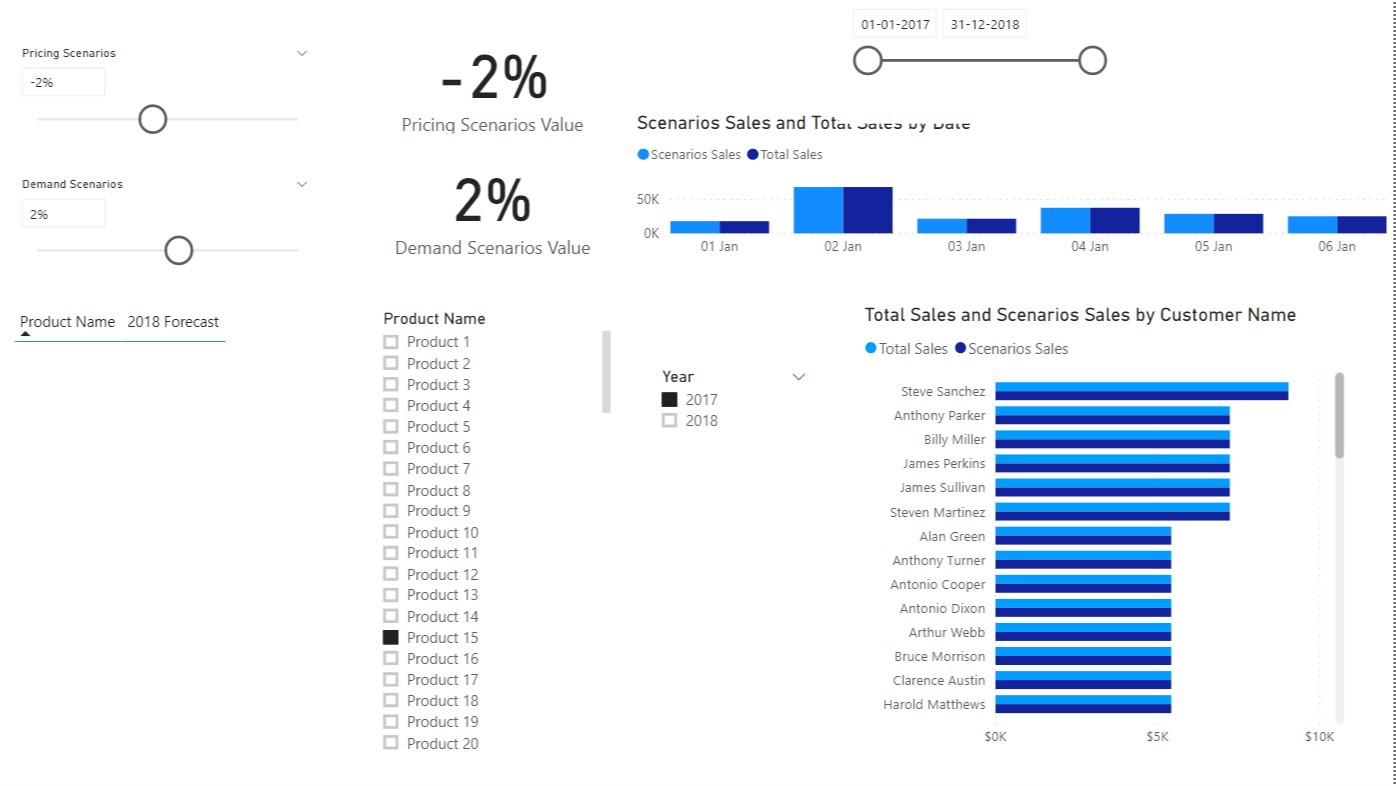
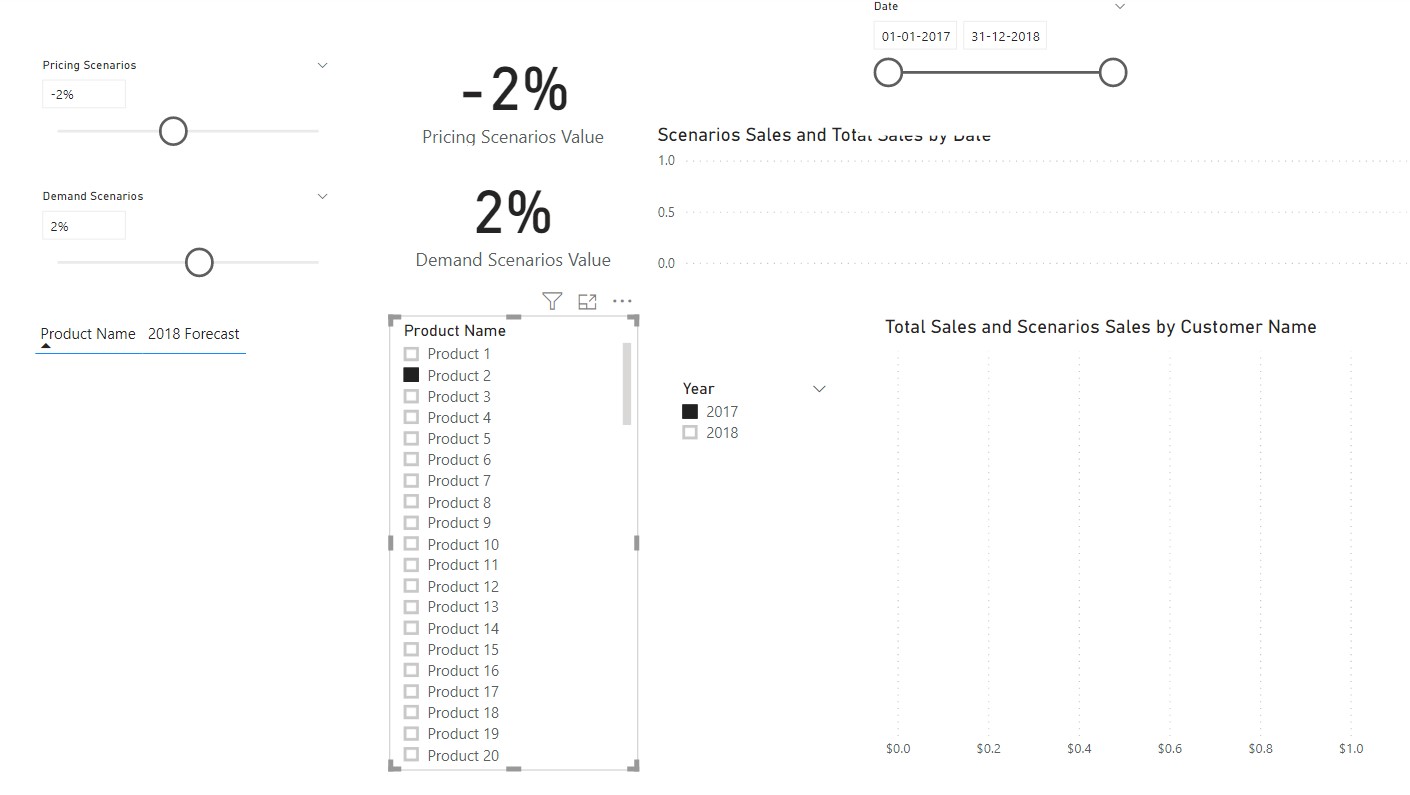
Also to cross the numbers and records I added a Product Name as well as Year slicer in Sheet 1 of your analysis and when I selected any Product Name between the range from 15 to 44 and Year = 2017 it correctly showed the results but when I selected outside the range as mentioned above it showed the blank values. Below are the screenshots provided for the reference.

Also if you think that Distinct function hasn’t worked correctly in this case, then you can try to create another table with the formula given below and still you’ll receive the same results.

2018 Forecast 1 = 
ADDCOLUMNS(
    SUMMARIZE(
        'Product' , 
        'Product'[Product Name] ) , 
        "2018 Forecast" ,
        CALCULATE( [Total Sales] , Dates[Year] = "2017" ) * 1.05 )

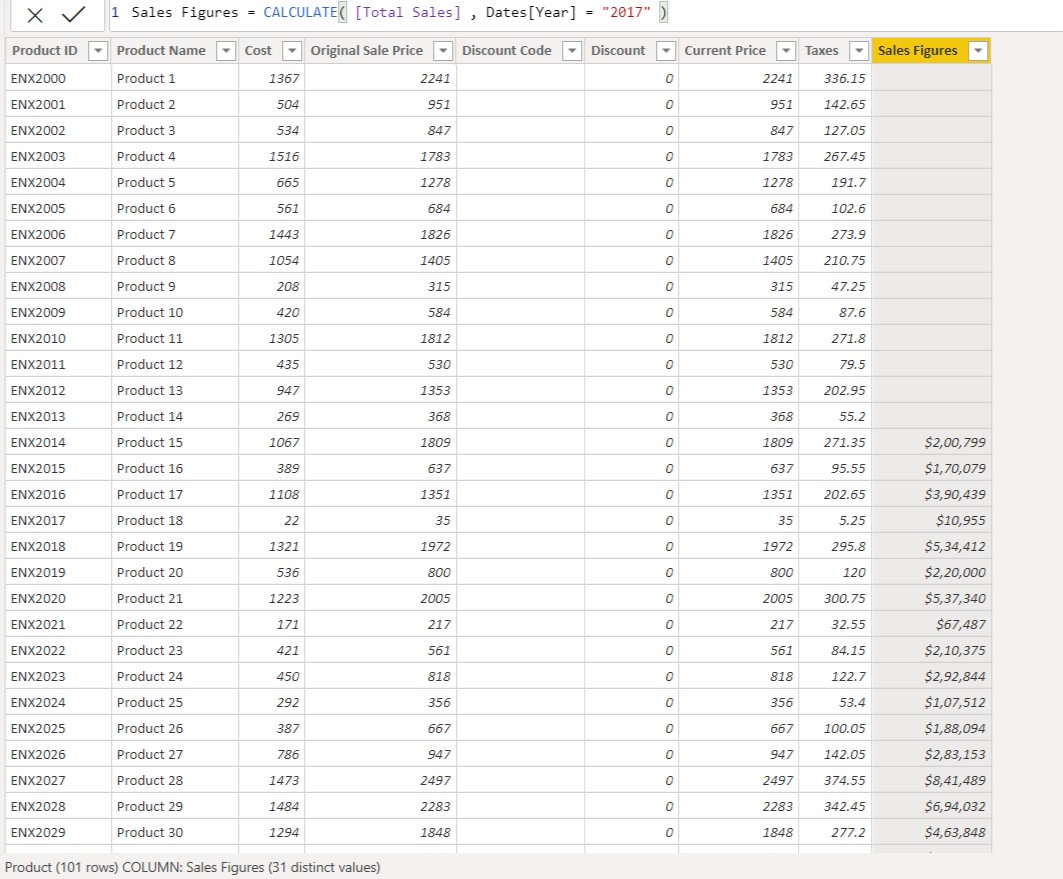
And lastly just for the reference I also added a calculated column of Sales Figures with the Year = 2017 and there were no records against it. Below is the screenshot provided for the reference.

As far as data is concerned, yes there is mismatch between the Excel and PBIX file provided but you can still proceed with the practice by presuming that the other products will be launched in the Year = 2018 and therefore against this products forecasting cannot be done since there are no past/performance records of it in order to do the Forecasting.

I’m also attaching the PBIX file for the reference.

Hoping you find this useful and helps you to go ahead with you practice.

Thanks & Warm Regards,
Harsh

Scenario Analysis (1).pbix (547.1 KB)

Hello Harsh,

What I meant by “I wonder why the distinct did not work as it supposes to” on one of the courses Sam use Distinct instead of Value formula as Value will provide results even for blank products whereas Discitnctn should exclude blanks and only provide results for products in this example where the sales occurred.

Sam explains the difference between Values and Distinct and for me, Distinct didn’t show correct results in 100%. Distinct it only shows the value that has values in it

Have I done something worng or the Power BI formulas has changed since Sam recoded the online training?

Hello @Matty,

Just give me 10 minutes and I’ll get back to you with the detailed explanation.

And don’t worry there’s nothing wrong with your formula. :slightly_smiling_face:

Thanks & Warm Regards,
Harsh

@Harsh Thank you for help I will have one more question.

At the VIsualization I can’t drag table in order to sort them in my way. The table are always sorted in alphabetical order (only measures table are on top), wheres Sam during his allcourse can sort manually.

Is this due to licences?

Hello @Matty,

Actually I’d already completed that course and just to cross - check again I’ve checked the video and these were the words of @sam.mckay in that video -

“VALUES() and DISTINCT() will return me the same result. The only difference between these two functions is if there are blank values in it, it would have been picked up if we use VALUES function and if there was one row that did have that blank it would have actually appeared in this particular table but if we use DISTINCT it wouldn’t appear.”

Now, it is to be noted that in what context he has referred the term “Table” as. In the given example, as stated above, there was only a single list of column in that particular table and therefore in this context the only single column also became the table and he said that if that list had contained blank then it would have ignored blank value in case of DISTINCT function and it would have been considered in the case of VALUES function.

He had used two columns there and if the list contained blank value in it then DISTINCT function would have still ignored it because the condition was applied on “Warehouse Code”.

Now in your case also the condition is applied on “Product Name” so had it contained any blank value in it, it would have ignored it and similarly it would have been taken into account if we use VALUES function.

I’m providing a link of a video where Patrick from Guy in a Cube YouTube Channel has explained the same concept. Although the video is regarding the blank value contained in a slicer but it is very much applicable to our discussion and this is the same concept that @sam.mckay had tried to explain in his video but since his data was well formatted and didn’t contained any blank value in his list it was left to our understanding, presumption and imagination given the circumstances if it contained any blank value in it.

Hoping you find this useful and helps you in your analysis as well as understanding of the concept between “VALUES()” and “DISTINCT()” function. :slightly_smiling_face:

Please feel free to write back in case I’ve missed out on anything.

Thanks and Warm Regards,
Harsh

Video Link - Why is there a blank in my Power BI slicer???

Thanks @Harsh I read your reposnd a few times to get better understanding!

Much appreciated!

Hello @Matty,

You’re welcome. :slightly_smiling_face:

Glad I was help you and all the best for your practice.

Thanks & Warm Regards,
Harsh

Hello @Matty,

Just came to my mind that there’s one video of @sam.mckay where he had used “VALUES()” function in both the conditions at first and then he had to switch over to the “DISTINCT()” function in one of the condition while creating a Budget Table.

I’m providing a screenshot as well as a link of that video.

I thought this might be useful to you in your practice. :slightly_smiling_face: I suggest you to go through this video so that it may help to understand it more.

Thanks & Warm Regards,
Harsh

Video Link - Advanced Data Transformations & Modelling - Intermediary Tables

Thank you @Harsh :slight_smile:

After re-watching it I undestand better :slight_smile:

Hello @Matty,

You’re welcome. :slightly_smiling_face:

Thanks & Warm Regards,
Harsh