This is a simplified version of my problem but hopefully not too simplified that gives the wrong answer.
I’ve got a factory that can produce 200,000 of a product each day. Based on orders, I’ve got a required amount to be produced each day. Any product not produced on the required day needs to roll into the required amount for the following day. I’m trying to calculate for each day whether I’m under or over capacity.
For example imagine this:
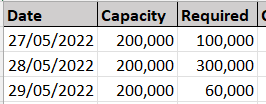
For the 27th I’m fine.
For the 28th I’m over capacity, by 100,000
Which means for the 29th, I’m now making 160,000, which is still fine.
However if the 28th was 400,000 required, that would’ve made the 28th 200,000 over, making the 29th 260,000 and over capacity, pushing a further 60,000 into the 30th and so on. I keep going back and forth in my mind whether cumulative totals would give me the answer, but I keep thinking I’d need the granularity of each day due to the carry overs.
I can work this out in SQL, but ideally I’d like it to be in DAX as my real model has a what if parameter for the user to tweak the amount produced per hour, which combined with the number of employees each day changes the capacity for each day.
I’ve dummied some data below with excel formulas for expected results, is this possible to do in DAX?
Thanks in advance!
Capacity Plan Example.xlsx (13.3 KB)