I have typical requirement. We are implementing row level security. As part of the security requirement, we would need to show/restrict few columns in dashboard. Example: When VP login to power BI, he should see column1, column2, column3, cloumn4,column5. When RL logins to power BI, he should able to see column2, column3, cloumn4, column 5. when DL login to Power BI he should able to see column3,cloumn4,column5. Do we have any dynamic conditional method in power bi based on RLS
Can you provide more details or perhaps even a mock up? Because what do you mean by should see column1, column2, column3, cloumn4,column5. Is that in a table/matrix visual? or??
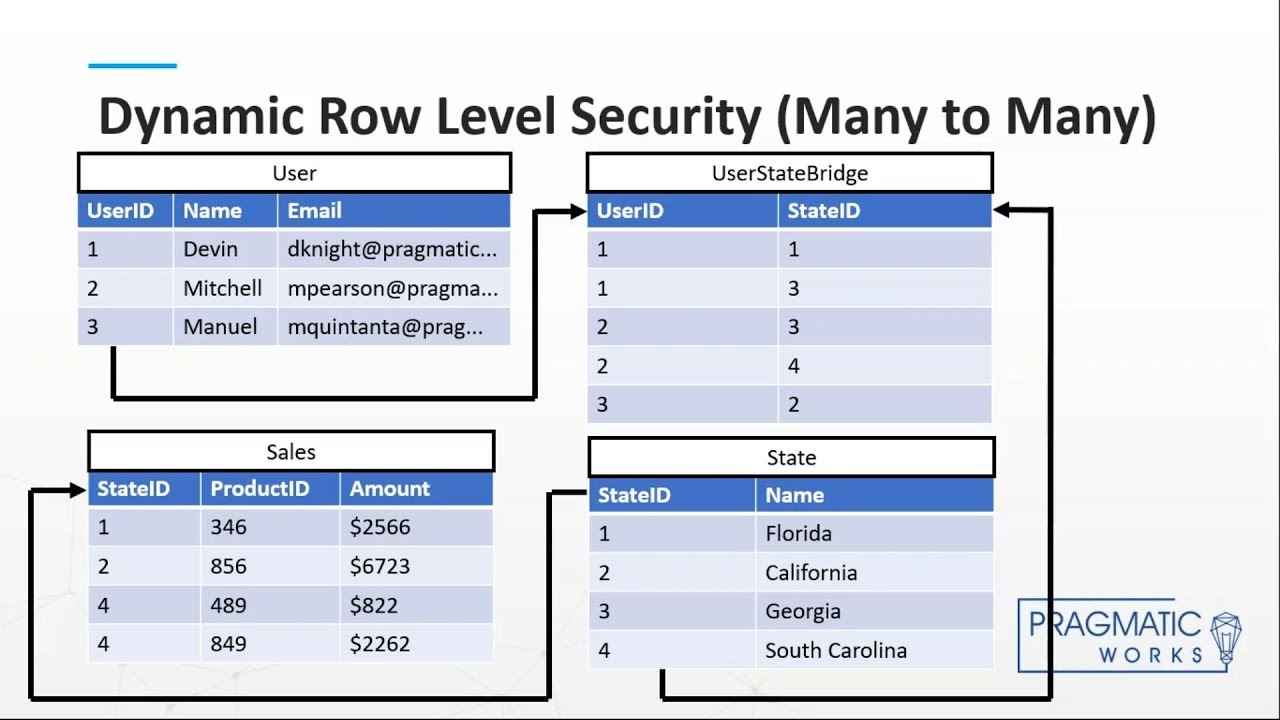
Here’s something to get you started.
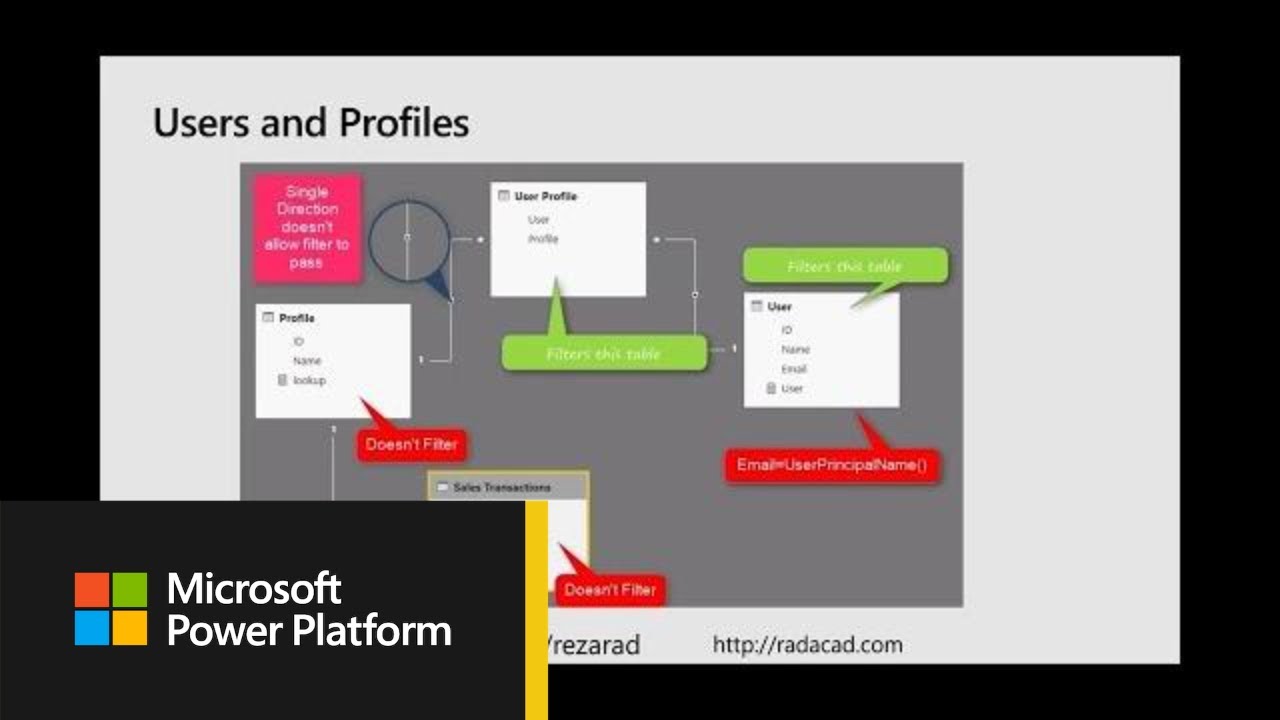
more about RLS from RADACAD:
- Row Level Security in Power BI
- Dynamic Row Level Security
- Dynamic Row Level Security with Manager Level Access
- Dynamic Row Level Security with Users and Profiles
- Dynamic Row Level Security with Organizational Hierarchy
- Row Level Security with Analysis Services Live Connection
- Row-level Security with Many to Many and Organizational Hierarchy
- Calculating Totals in a row-level security implementation
- Data Masking without RLS
- Data Masking with RLS
.
Hi @rush2bi
Your requirement is not row level security, Its column level security.
In Power BI we don’t have CLS like RLS.
Doing it is a bit tricky, but you can try
yes. its column level security based on the roles. Thanks Rajesh.
Thanks for posting your question @rush2bi. To receive a resolution in a timely manner please make sure that you provide all the necessary details on this thread.
Here is a potential list of additional information to include in this thread; demo pbix file, images of the entire scenario you are dealing with, screenshot of the data model, details of how you want to visualize a result, and any other supporting links and details.
Including all of the above will likely enable a quick solution to your question.
Hi @rush2bi
I tried your requirement… column level restriction.
You can try below process and let me know if it works for you.
Step 1: Created below tables.
Step 2: Applied some transformations for Data table and Columns table
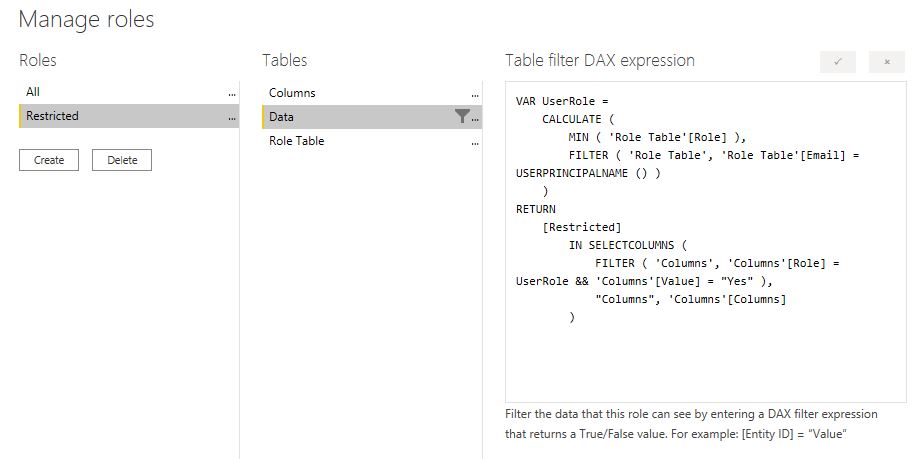
Step 3: Created 2 roles
RLS Logic
Step 4: Create Matrix visual
Step 5 : Publish
Step 6: Assign users to roles
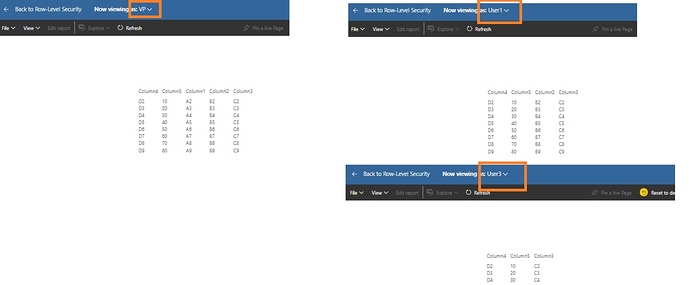
Step 7: Test
VP login he can see all fields,
User1 and User2 logins they can see only 4 columns
User3 and User4 can see only 3 columns
Dynamic Columns.pbix (37.2 KB)
Dynamic Columns.xlsx (11.7 KB)
Hi @rush2bi, a response on this post has been tagged as “Solution”. If you have a follow question or concern related to this topic, please remove the Solution tag first by clicking the three dots beside Reply and then untick the check box. Also, we’ve recently launched the Enterprise DNA Forum User Experience Survey, please feel free to answer it and give your insights on how we can further improve the Support forum. Thanks!
