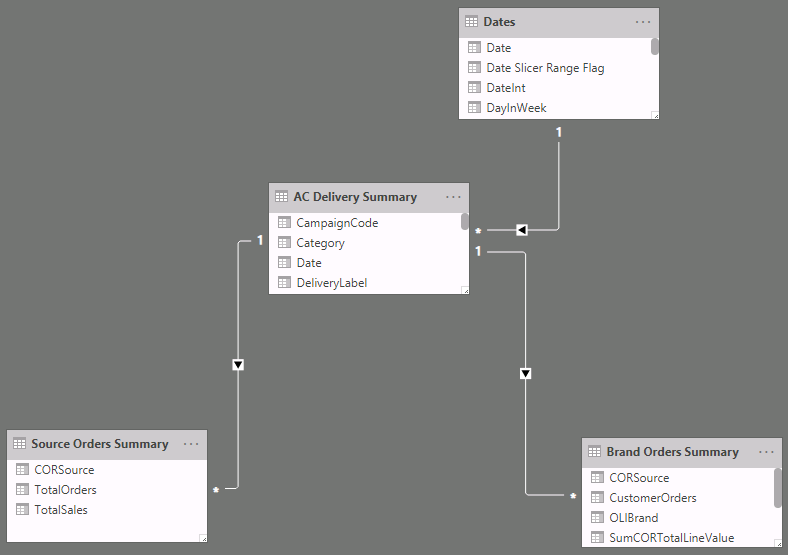
I have a fairly simple data model whereby I have a email campaign table that contains a distinct list of email campaigns (unique Campaign Code) with a series of delivery metrics as columns.
This table is linked (one-many) to a sales table that along with the Campaign Code value, has a related product brand column along with the total order number and value for that product brand and email campaign, i.e. the number/value of specific product sales attributed to that email campaign.
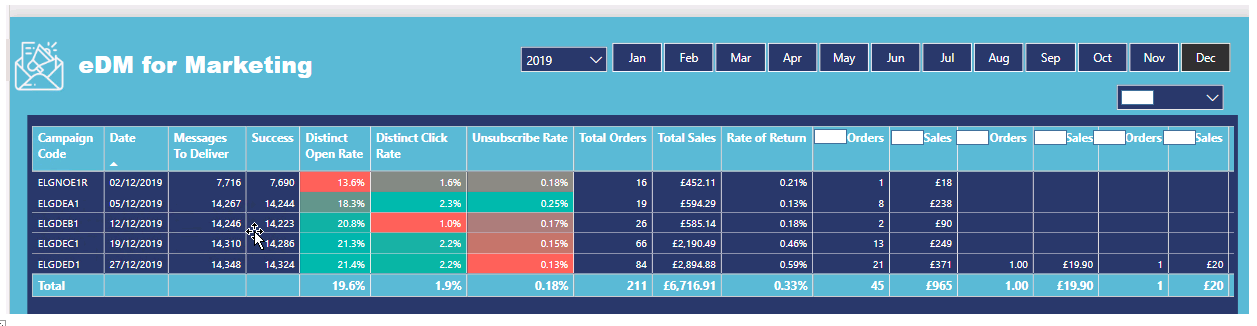
I have created a grid that displays each of the email campaigns as rows together with the delivery metrics as columns and additionally, columns for each of the product showing the aggregate sum totals for both numbers and value sold.
I want to replace these blank cells and replace them with a ‘0’ and changed the measure to the following to achieve this:
Active Orders Alt = CALCULATE( SUM( ‘Brand Orders Summary’[CustomerOrders] ) , ‘Brand Orders Summary’[OLIBrand] = “ACTIVE” ) + 0
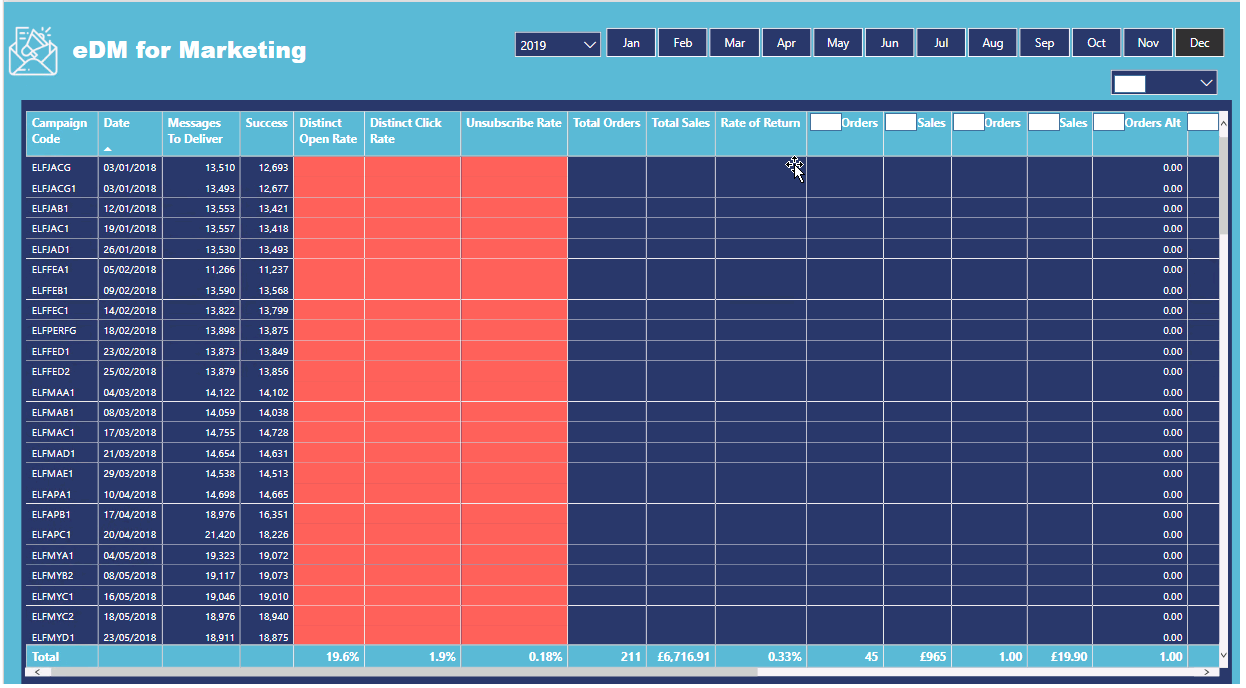
This has the effect of adding additional unwated rows to the grid, seemingly for all records from the underlying ‘Brand Orders Summary’ table rather than those that are applicable based on the year and month slicer selections:
Welcome to the forum. Just a quick question have you tried this:
Active Orders Alt =
VAR Result =
	CALCULATE(
		SUM( ‘Brand Orders Summary’[CustomerOrders] ),
		‘Brand Orders Summary’[OLIBrand] = “ACTIVE”
	)
RETURN

IF( Result = BLANK(), 0, Result )
.
Does that have the same effect on your matrix visual?
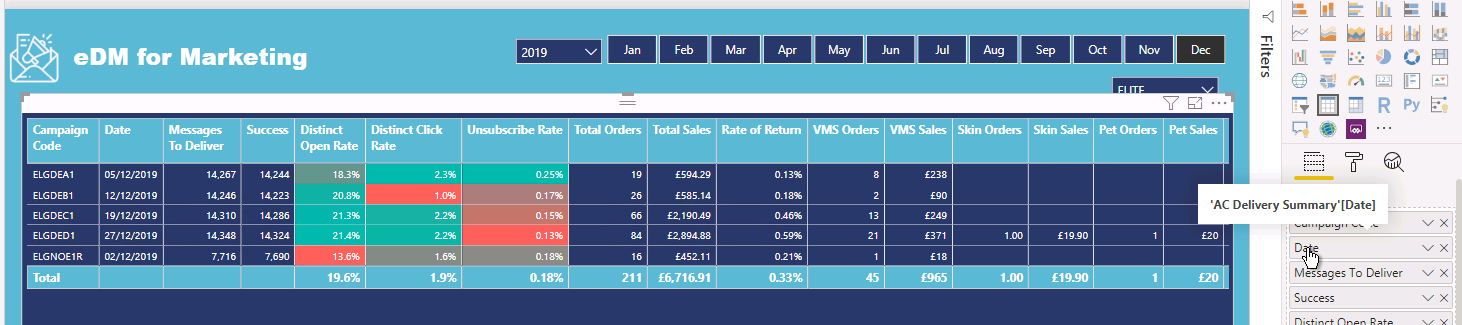
Does the Date field in your Matrix come from the Dates- or AC Delivery Summary table?
thank you very much for your reply. I have tried your suggestion but unfortuantely it was unsuccessful. I had attempted a similar approach by creating a secondary measure with the IF condition that evaluated the original measure.
In answer to your question, the Date and Year fields used in the slicers are from the Dates table and not from AC Delivery Summary table - see below:
The unwanted rows are only filterable by their date value which works perfectly fine if I don’t attempt to deal with the blank cells within the measure.
It’s as if the application of the blank cell evaluation criteria overrides the effect of the slicer filter and all records are returned as a result.
I have just adjusted the ‘Total Orders’ ‘Filters on this visual’ element to 'is not blank which has had the desired effect.
So from a solution perspective, this is great but I would still like to understand why adjusting a measure from:
Active Orders Alt = CALCULATE( SUM( ‘Brand Orders Summary’[CustomerOrders] ) , ‘Brand Orders Summary’[OLIBrand] = “ACTIVE” ) + 0
has such a siginifcant and disruptive efffect. Any thoughts would be greatly appreciated.
I am relatively new to Power BI development and am finding that the application of measures and filters in certain circumstances - i.e. context - does not always appear to be logical.
I’m hoping that I just need to become more familiar with the Power BI approach and specifically the understanding of context so being able to explain the above peculiarity would certainly help.
Active Orders Alt = CALCULATE( SUM( ‘Brand Orders Summary’[CustomerOrders] ) , ‘Brand Orders Summary’[OLIBrand] = “ACTIVE” ) + 0
In above formula that you mentioned, 0 added is outside inner filter context of calculate, so it brings ALL dates from your “AC Delivery Summary table” and not only dates in which following filter is active.
‘Brand Orders Summary’[OLIBrand] = “ACTIVE”
So, that means by adding “0” at the end, it will show all dates from “AC Delivery Summary table” . Does that make sense?
thank you very much for your reply which does make sense. However, this did occur to me and I tested the alternative measure below but it didn’t resolve the problem unfortunately:
End of the day here but this might work as it’s a bit outside the box.
Create a measure summing up Distinct Open Rate, Distinct Click Rate and Unsubscribe Rate. Then drop that measure into your filter to show where value does not equal 0.
thanks for your response and suggestion. I have already adopted a similar approach where the visual is filtered to only include records where the ‘Messages to Deliver’ metric is > 0 - this should always be the case for the eligible records based on the selected slicer values.
What I’m still trying to understand is why the addition of ‘+ 0’ to the CALCULATE function, either outside of, or within the scope of the calculation, results in the slicer selections being ignored.
I got the reason what you are after. To understand this behavior , we need to understand evaluation of Calculate. It first applies all filters and only after that is starts calculations. So, in your case, it applied filter on Year/Month from slicer, Compaign code/ AC delivery summary[Date] from visual and “ACTIVE” from within calculate. So, all rows will be calculated based on this filter context. However, addition of 0 will force showing all results as it will be mistaken by 0 inactive orders instead of no orders at all. So, in summary, slicers are used as filters for calculation and not to restrict rows in visual.
thanks again for your response which I think I’m following but would you mind clarifying what you mean by “will force showing all results as it will be mistaken by 0 inactive orders instead of no orders at all”?
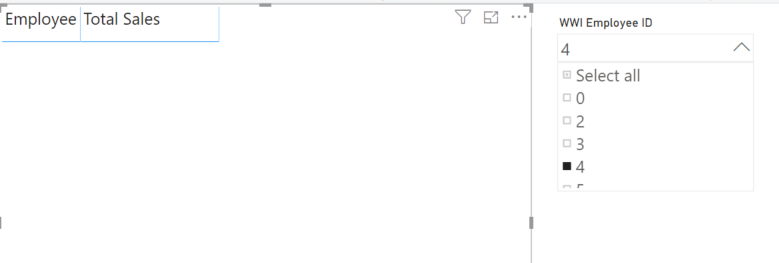
If you will put 0 in calculation, it will show that row although it has no value. e.g if in below picture, you will see I can “Isabella Rupp” although her sale is 0. But if I removed Measure with 0, It will not show that row at all.
thanks for your response which has now clarfied the matter. I really appreciate you taking the time, as well as John.Fricke and Melissa, to help me resolve the query.
To the contributors of this post, thank you for all your inputs on this topic we are now tagging it as Solved. To help us learn more about your experience in the forum, please take a moment to answer this short forum survey. We appreciate all your help and suggestions. Thanks!